Figure 3.
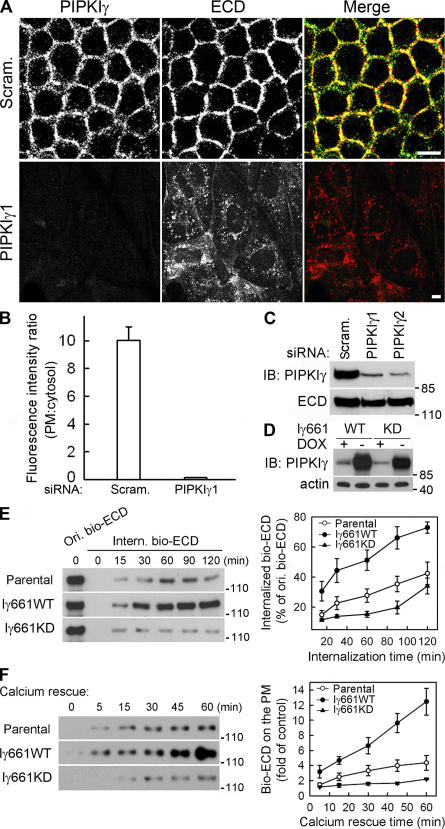
PIPKIγ is required for E-cadherin assembly and trafficking. (A) MDCK cells were treated with scrambled (Scram.) or PIPKIγ-specific siRNA (PIPKIγ1). PIPKIγ (green) and ECD (red) were visualized by indirect immunofluorescence. Bars, 10 μm. (B) PM or cytosolic fluorescence intensity of cells in A was quantified from six randomly picked fields (5 cells/field) representing three independent experiments were randomly counted. The intensity ratio was plotted using SigmaPlot 8.0. Error bars are ± SEM. (C) PIPKIγ and E-cadherin protein levels in cells treated with scrambled (Scram.) or PIPKIγ-specific siRNAs (PIPKIγ1 and PIPKIγ2) were shown by immunoblots. (D) Protein levels of endogenous and inducibly overexpressed PIPKIγ661wild type (Iγ661WT) or knock down (Iγ661KD) in stable MDCK lines were determined. Actin was used as a loading control. (E) After surface biotinylation, cells expressing the indicated proteins were lysed before or after exposure to 0.5 mM EGTA at 18°C to examine the original biotinylated E-cadherin (Ori. bio-ECD) and the internalized biotinylated E-cadherin (Intern. bio-ECD). Data was quantified and plotted from four independent experiments. (F) Calcium restoration subsequent to EGTA treatment induced E-cadherin recycling. The extent of this recycling was quantified in cells expressing the indicated proteins. Data were quantified and plotted from three independent experiments. The values representing surface E-cadherin without calcium rescue were used as control. Error bars are ± SEM.

