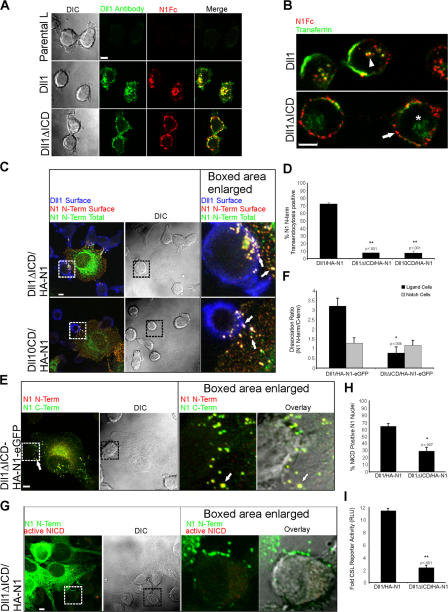
Figure 7.
Notch1 transendocytosis, hNotch1 subunit separation, and signaling require Dll1 endocytosis. (A) Dll1, Dll1ΔICD, or parental L cells were incubated with rabbit Dll1 extracellular domain (ECD) antibodies and N1Fc to track Dll1. After incubation, the cells were fixed, permeabilized, and stained with anti–rabbit Alexa Fluor 488 to detect Dll1 antibodies (green) and anti–human Fc conjugated to Cy5 (red) to detect N1Fc. (B) Dll1 or Dll1ΔICD cells were incubated with N1Fc preclustered with anti–human Fc conjugated to Texas red (red), and transferrin conjugated to FITC (green). Arrowhead indicates internalized N1Fc colocalized with transferrin in Dll1 cells (yellow). Arrow indicates N1Fc on the surface of Dll1ΔICD cells (red). Asterisk indicates internalized transferrin. (C) Cocultures of HA-N1 cells and Dll1ΔICD or Dll10CD cells were treated as in Fig. 2 C to identify surface mutant Dll1 (blue), surface N1 N terminus (red), and total N1 N terminus (green). Arrows indicate N1 N terminus on the surface of the Notch cell (yellow), as well as the mutant ligand cell (white). (D) Transendocytosis was quantified as in Fig. 2 D. (E) Cocultures of HA-N1-EGFP and Dll1ΔICD cells were treated as in Fig. 4 A to identify N1 N terminus (red) and N1 C terminus (green). Arrow indicates double-positive HA-N1-EGFP cluster (yellow). (F) Dissociation ratio was quantified as in Fig. 4 B. (G) Dll1ΔICD cells were cocultured with HA-N1 cells and treated as in Fig. 3 A to identify N1 N terminus (green) and activated NICD (red). (H) NICD-positive nuclei were scored as in Fig. 3 B. (I) CSL reporter assay, as in Fig. 3 C. Cells in A–C, E, and G were imaged by confocal and DIC microscopy. Boxes indicate enlarged regions. Overlays are composites of fluorescent and DIC images. *, P < 0.05; **, P < 0.001; t test relative to Dll1 cells. Error bars represent the SEM (D, F, and H) and the SD (I). Images from each experiment were uniformly adjusted using the levels function in Photoshop. Bars, 5 μm.

