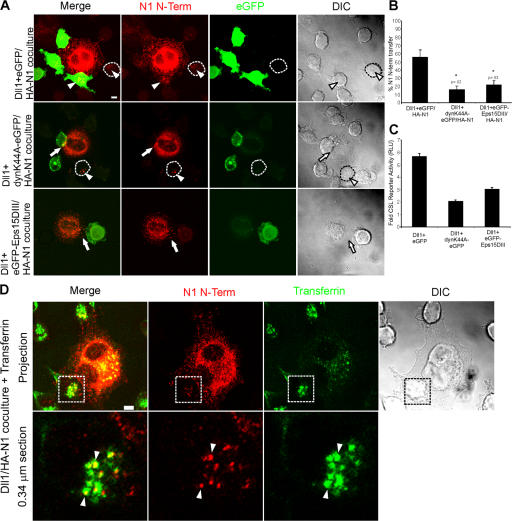
Figure 8.
Notch1 transendocytosis and signaling require general endocytic machinery. (A) Dll1 cells were transiently transfected with EGFP, dynaminK44A-EGFP, or EGFP-Eps15DIII, and then cocultured with HA-N1 cells. Cocultures were fixed, permeabilized, and stained with a mouse HA antibody (262K) and anti–mouse conjugated to Alexa Fluor 568 to detect the N1 N terminus (red), followed by rabbit anti-GFP conjugated to Alexa Fluor 488 to detect EGFP (green). Arrows indicate interacting N1 N terminus. Arrowheads indicate N1 N terminus associated with Dll1 cells. An untransfected Dll1 cell is outlined. Fluorescent images are confocal projections through the midsection of the Dll1 cell. (B) Transfer of N1 N terminus was quantified by examining Dll1 cells displaying EGFP fluorescence for internal N1 N terminus (see Materials and methods). (C) HA-N1 cells transfected with a CSL-luciferase reporter were cocultured with HEK 293-T cells cotransfected with Dll1 and EGFP, dynaminK44A-EGFP, or EGFP-Eps15DIII and assayed for luciferase activity. Values are fold-induction over vector + EGFP-transfected cells. (D) HA-N1 cells were cocultured with Dll1 cells in the presence of transferrin conjugated to FITC (green). Cocultures were fixed, permeabilized, and stained with a mouse HA antibody (262K) and anti–mouse conjugated to Alexa Fluor 568 to detect the N1 N terminus (red). Arrowheads indicate colocalization of transferrin and N1 N terminus in Dll1 cells (yellow). Boxes denote enlarged region. Low magnification fluorescent images are confocal projections, and enlargements are a 0.34 μm confocal section through the midsection of the Dll1 cell. Error bars represent the SEM (B) and the SD (C). *, P < 0.05; t test relative to Dll1+EGFP cells. Images from each experiment were uniformly adjusted using the levels function in Photoshop. Bars, 5 μm.

