Figure 7.
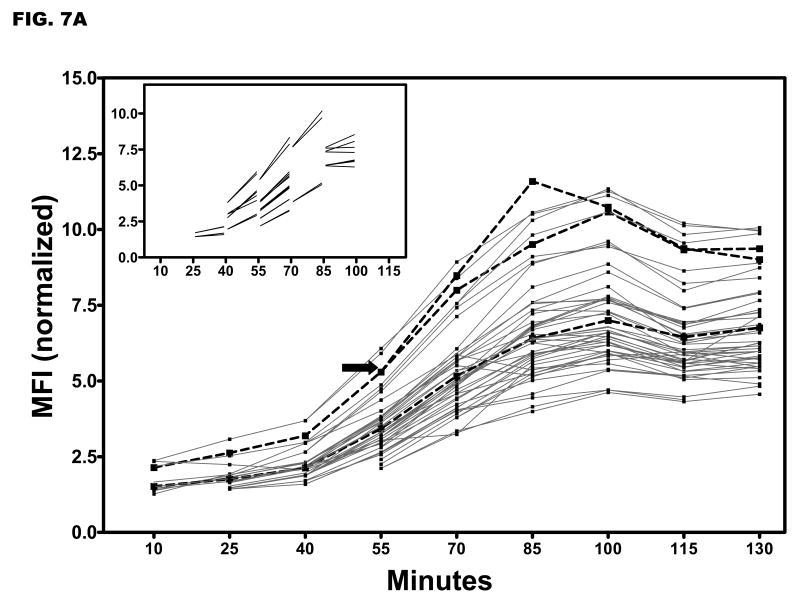
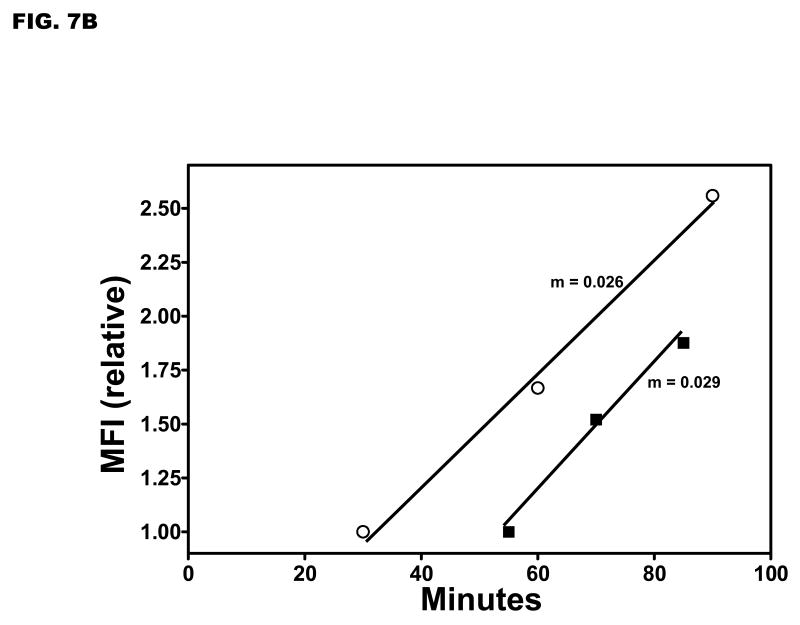
Single field analysis of Ca2+-dependent fluorescence in individual YPT/yopE::gfp cells. (A) The YPT/yopE::gfp strain was cultured as described in Fig. 1 and at time 0 a small aliquot of the culture was placed on an agarose pad (prepared with maximal inductive media) and maintained at 37 °C. Images of a single microscopic field were recorded every 15 minutes. To control for photobleaching, fluorescent intensities of the cells were normalized to that of a fluorescent bead that was present in the same field. For illustrated purposes, the traces of two different cells are highlighted in thicker, broken lines; one of these highlighted cells completes cytokinesis during the experiment (indicated by an arrow). (inset) From the same data set are shown cells completing cell division; only data just prior to or immediately following cytokinesis is shown. (B) Plotted is the relative changes in the mean fluorescence of YPT/yopE::gfp cells induced either in liquid (open circles, data from Fig. 4) or on semi-solid media (solid boxes, data from Fig. 7A).


