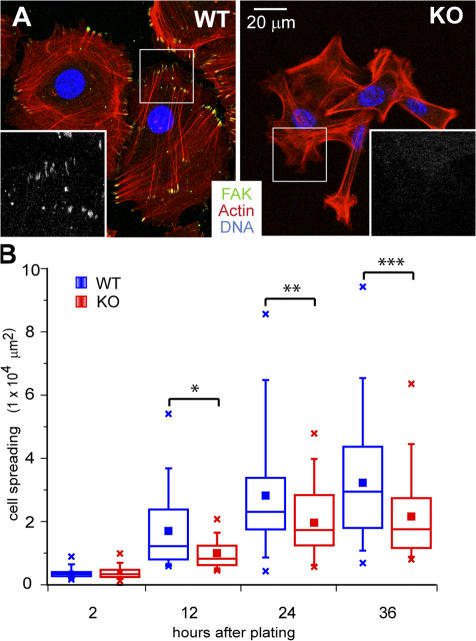
Figure 4.
Keratinocytes lacking FAK display an exaggerated FA-actin stress fiber network and constricted cell morphology. (A) Immunofluorescence microscopy of representative MKs from WT and Fak cKO epidermis spread on FN for 48 h and labeled with anti-FAK (green), phalloidin (red), and DAPI (blue). Boxed areas are magnified in insets, which show only anti-FAK staining. (B) Box-and-whisker plot of cell spreading kinetics, indicating the mean (squares), 25th percentile (bottom line), median (middle line), 75th percentile (top line), 5th and 95th percentile (whiskers), and minimum and maximum measurements (x). Morphometric analyses of cell spreading were performed by measuring the average contact area between the cell and its substratum in square micrometers described in box-and-whisker diagrams. n ≥ 60 cells per time point. Asterisks indicate significant differences between WT and KO (t test). Note that differences in spreading increased over time. *, P = 0.025; **, P = 0.0018; ***, P = 0.0006.

