Figure 5.
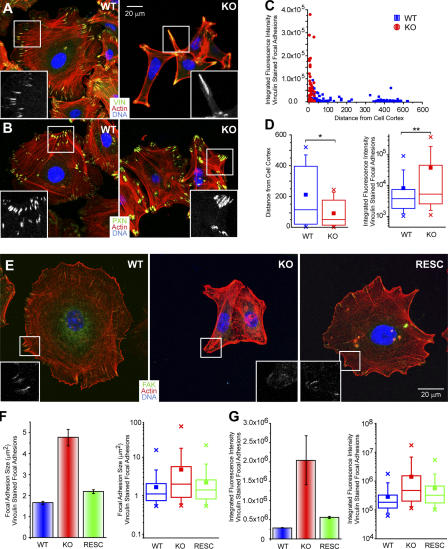
FAK-dependent differences in FA size and distribution. (A and B) Immunostaining of WT and Fak-KO keratinocytes for actin (red), nuclear chromatin (DAPI; blue), and FA markers VIN and PXN (green). (C) Scatter plot indicating the integrated fluorescence intensity of VIN-labeled FAs and their relative position from the cell cortex. (D) Box-and-whisker diagrams describing the distribution of FAs from the cortex to the center and the relative fluorescence intensity of VIN-labeled FAs. Box-and-whisker plots indicate the mean (squares), 25th percentile (bottom line), median (middle line), 75th percentile (top line), 5th and 95th percentile (whiskers), and minimum and maximum measurements (x).*, P = 0.00003; **, P < 0.00001 (t test). (E–G) Retroviral infection and expression of recombinant FAK rescued the defects in actin cytoskeleton and FA size and distribution. (E) Immunostaining of representative WT, Fak-KO, and FAK-rescued Fak-KO MKs with anti-FAK (green), phalloidin (red), and DAPI (blue). Insets show FAK staining, absent in KO but restored in FAK-rescued KO cells. (F and G) Quantitative analysis on VIN-stained KO, WT, and KO cells reexpressing FAK (RESC) show that the size of KO FAs and their relative VIN staining intensity was restored upon reexpression of FAK in KO keratinocytes. Error bars indicate SEM.

