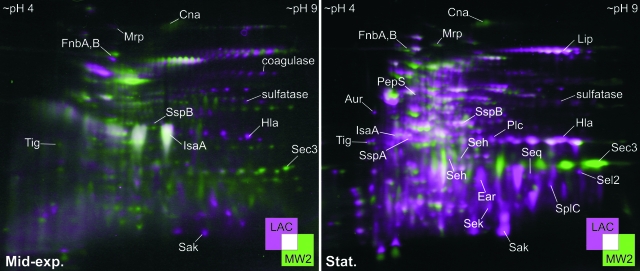
Fig. 2.
2-DGE analyses of culture supernatant proteins produced by MW2 and LAC. Proteins from MW2 (green) and LAC (magenta) culture supernatants were analysed by proteomics. Left panel, proteins from cultures at mid-exponential (Mid-exp.) phase of growth. Right panel, proteins from cultures at stationary (Stat.) phase of growth. White areas are regions of overlap. Selected proteins are indicated. Images are representative of three separate experiments.

