Figure 5.
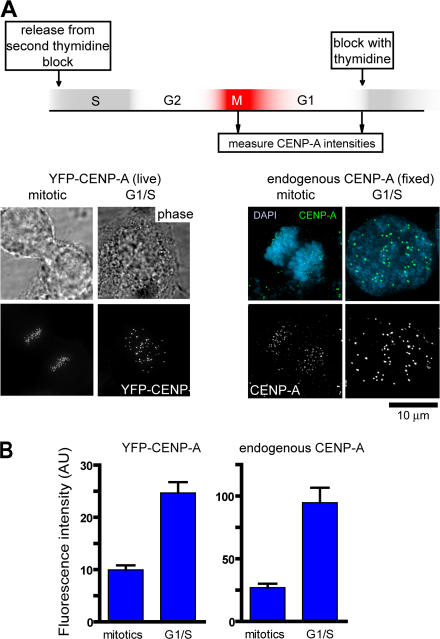
Centromeric levels of endogenous CENP-A increases during G1 phase. (A) HeLa cells stably expressing YFP–CENP-A (Kops et al., 2004) or parental HeLa cells were synchronized by tandem treatments with thymidine and released, and cells in mitosis or at the G1–S boundary were either imaged directly (YFP fluorescence) in live cells or processed for indirect immunofluorescence with anti–CENP-A (cell cycle times not drawn to scale). (B) Quantification of mean CENP-A intensity. For YFP–CENP-A, >600 centromeres from >10 cells, and for endogenous CENP-A, >200 centromeres from five different cells were quantified for each measurement. Error bars represents SEM of centromere intensity. AU, arbitrary units.

