Figure 1.
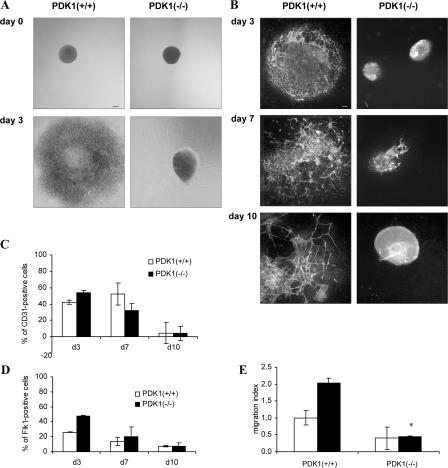
Knock-out of PDK1 affects early vascular development in EBs and EB-derived EC migration. (A) Representative phase-contrast images of EBs derived from PDK1+/+ and PDK1−/− ES cells at day 0 and 3 of differentiation. (B) EBs PDK1+/+ and PDK1−/− at 3, 7, and 10 d of differentiation were fixed and analyzed by indirect immunofluorescence with rat α-CD31 antibody; antigen–antibody complexes were detected with Cy2-conjugated donkey α-rat IgG. (C and D) FACS analysis of cells derived from EB PDK1+/+ and PDK1−/− at different differentiation stage (3, 7, and 10 d) to evaluate percentage of CD31- and Flk1-positive cells, respectively; data were plotted as the mean ± the SD of the percentage of positive cells from three independent experiments. (E) ES cells PDK1+/+ and PDK1−/− were differentiated into EBs for 3 d; they were then disaggregated, and cells were used in a chemotaxis assay, in the presence of a gradient of fibronectin (20 μg/ml) in combination (black bars) or not (white bars) with 30 ng/ml VEGF-A. Migration index is calculated assigning a value of 1 to the number of PDK1+/+ CD31-positive cells that migrated toward fibronectin; data were plotted as the mean ± the SD of five independent experiments. Statistical significance (*, P < 0.01) is shown for VEGF-A–stimulated EC-PDK−/− compared with EC-PDK1+/+. Images are representative of five independent experiments. Bars, 100 μm.

