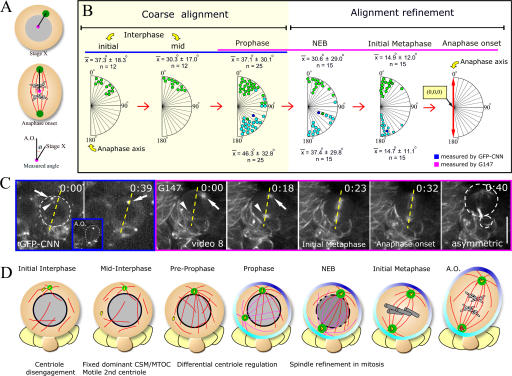
Figure 4.
Two phases of spindle alignment. (A) Cartoon showing measured angles. (B) Centrosome location relative to anaphase division axis onset. Green circles indicate the dominant centrosome, and blue circles indicate the second centrosome. In 1/25 NBs, the dominant centrosome (dark green) was on the GMC side of the nucleus at prophase; its second centrosome is shown in dark blue. Measurements used Cnn (blue; interphase and prophase) or MTs (pink). (C) Sample video stills. Yellow lines indicate anaphase-onset axis. (D) Cartoon showing centrosome/centriole cycles. Time is shown as h:min. Bar, 10 μm.

