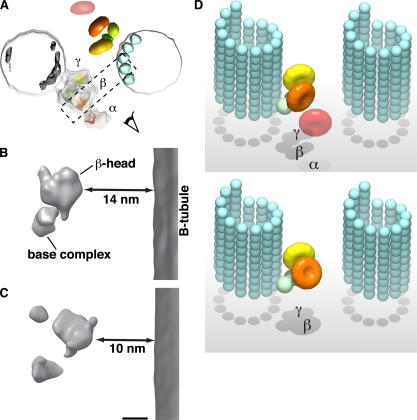
Figure 10.
Head domain displacement between the rigor state and the relaxed state. (A) An end-on view of the 3D reconstruction of the ODA–CB-MT complex in the rigor state. The box used for the slab view in B and C is shown as a dashed rectangle. (B and C) A comparison between the β head domains in the rigor state (B) and the relaxed state (C) showing the change in distance to the B tubule. The double arrows indicate the changes of distance between the β head domain and B tubule from 14 (rigor state) to 10 nm (relaxed state). (D) Model images of the ODA–MT complex in the rigor state (top) and the relaxed state (bottom). The α head domain is omitted from the relaxed state because of the uncertainty of the position. Bar, 5 nm.

