Figure 3.
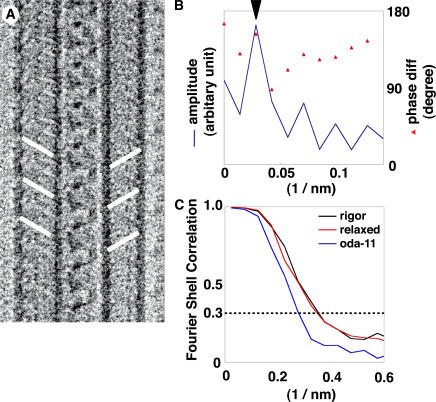
Arrangement of ODAs within the ODA–CB-MT complex and resolution estimation of the reconstructions. (A) A 24-nm filtered cryo-EM image of the ODA–CB-MT complex showing the staggered arrangement of the ODAs. Lines indicate the positions of ODAs. (B) An amplitude and phase plot of the 24-nm layer line from the ODA–CB-MT complex. Phase diff: the phase difference between the near and far sides. The theoretical phase difference is 180° if the two rows of ODAs are staggered. Amplitude: the amplitude of the layer line. The phase value at the amplitude peak (arrowhead) indicates the staggered arrangement of the ODAs. (C) The Fourier shell correlation curves for each reconstruction. The intersection between each curve and the horizontal line at 0.3 was taken as the effective resolution. The effective resolutions are 2.7 nm, 2.7 nm, and 3.5 nm for the rigor state, the relaxed state, and the oda-11 mutant, respectively.

