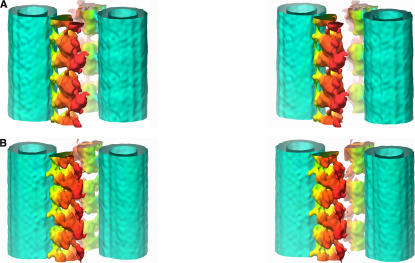
Figure 4.
3D reconstructions of the ODA–CB-MT complex from the wild type in two nucleotide states. A, rigor state; B, relaxed state. Stereo pairs are presented. The color reflects the distance from the center of the MT. The surfaces represent the isosurface of 120% of the volume estimated from the molecular weight of ODA.

