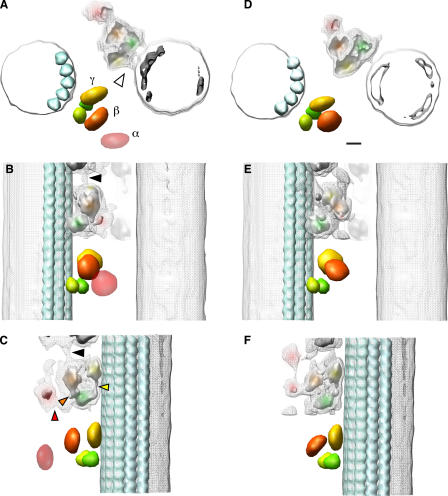
Figure 5.
3D reconstructions of the ODA–CB-MT complex in the rigor state and in the relaxed state. A–C, rigor state; D–F, relaxed state. (A and D) The views from the plus end of the MT. (B and E) The side views with the plus end up. (C and F) The 120° rotated side view seen from the inside of the complex. The mesh and solid surfaces represent the isosurface of 120% and 60% volumes, respectively, estimated from the molecular weight of ODA. The domains and fitted objects are colored as follows: the α head is pink, the β head is orange, the γ head is yellow, the base complex is green, and the MTs are light blue. The dark gray isosurface (A and D) shows the position of the protofilaments. The disk-shaped objects were placed according to the center of gravity of the head domain densities, and spherical objects were manually fitted to the densities of the base complex. The atomic models of the tubulins (Lowe et al., 2001) were fitted to the densities of the MT protofilaments (gray). The black arrowheads in B and C indicate the positions of the interdynein connections. The arrowhead in A indicates the position of the connection between the γ head domain and the MT. The red arrowhead in C indicates the connection between the α and β head domains. The orange and yellow arrowheads indicate the base complex β head domain and the base complex γ head domain connections, respectively. In C and F, the β head domain tilts 44° toward the MT in the relaxed state. Bar, 5 nm.

