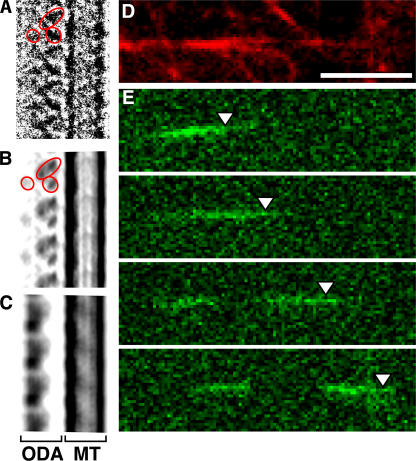
Figure 6.
Demonstration of the motility of the ATP-treated ODA–CB-MT complex. (A) A cryo-EM image of the ATP-treated ODA–CB-MT complex. The ODA–CB-MT complex was treated with 20 μM ATP for 3 min before freezing. The signal of the ODA was enhanced by averaging seven molecules. The overall shape appears triangular. (A and B) The red circles indicate the domains of ODA. (B) A 2D projection of the 3D reconstruction of the ODA–CB-MT complex in the rigor state representing the view in which the ODA is bound to the MT by its base side. The projection resembles the image in A in the position of the domains and the triangular shape. (C) A projection representing the view in which the ODA is bound to the MT by its stalks. (D and E) In vitro motility assay of the ODA–MT complex. (D) The AlexaFluor543-labeled ODA–CB-MT complex was treated with 20 μM ATP and immobilized on the glass coverslips (red). (E) An image sequence of the AlexaFluor488-labeled plain MT (green) showing an MT sliding along the ODA–CB-MT complex. The time interval between each image is 0.5 s. The arrowheads indicate a reference point on the sliding MT. Bar, 5 μm.

