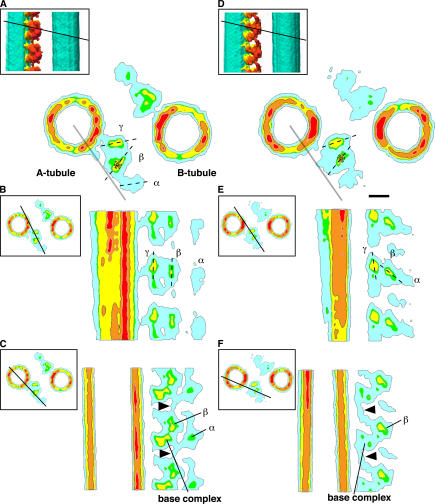
Figure 8.
Cross sections of the ODA–CB-MT complex in the rigor state and in the relaxed state. A–C, rigor state; D–F, relaxed state. The plane of each section is indicated in the top left corner (solid lines). The nucleotide-induced displacement (A and D) and inclination (B and E) of the β head domain is shown. The dotted lines indicate the long axes of the head domains. (A and D) The asterisks indicate the centers of gravity of the β head domain. The gray lines are placed as a reference. The β head domain in the relaxed state displaced 3.7 nm compared with its position in the rigor state. The position of the inter-ODA linker is indicated with arrowheads in C and F. The blue contour corresponds to the 120% volume isosurface; green, yellow, orange, and red indicate increasing density. Bar, 10 nm.

