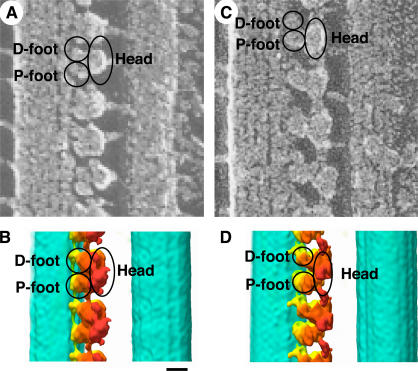
Figure 9.
A comparison of the QFDE-EM images of the axoneme and the corresponding views of the ODA–CB-MT complex in the rigor state and in the relaxed state. (A and C) QFDE-EM images of the axoneme (Goodenough and Heuser, 1982). (B and D) Corresponding views of the ODA–CB-MT complex. Views in the rigor state (A and B) and in the relaxed state (C and D). The densities corresponding to the D foot, P foot, and head are indicated. Bar, 10 nm.

