Figure 6.
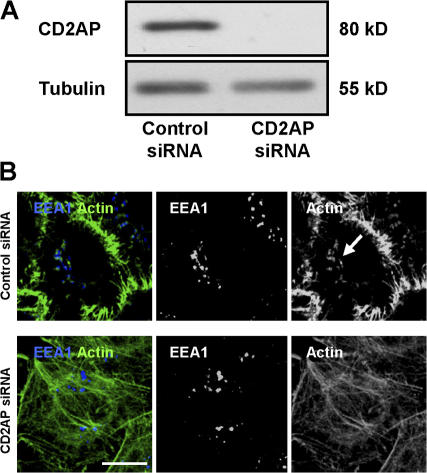
CD2AP knockdown by siRNA leads to a loss of F-actin structures associated with EEs and to an increase of stress fibers. (A) The expression of CD2AP was determined by Western blotting using cell extracts prepared 48 h after transfection with CD2AP siRNA or control siRNA. Western blotting against tubulin was used as loading control. (B) HeLa cells were fixed, permeabilized, and processed for the detection of actin (green) and EEA1 (blue) 48 h after transfection with CD2AP siRNA (bottom) or control siRNA (top). Cells were then analyzed by confocal microscopy. One confocal section corresponding to each individual labeling and a merged image are shown (see Fig. S4 for a full field of analyzed cells and confocal z stack of cells from B; available at http://www.jcb.org/cgi/content/full/jcb.200609061/DC1). Arrow shows the presence of actin tails in the control. Bar, 10 μm.

