Figure 7.
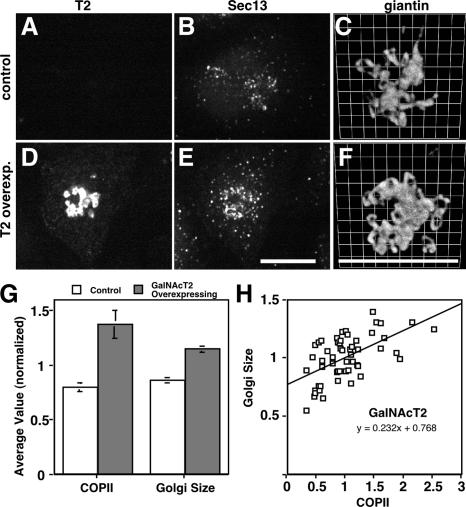
GalNAcT2 up-regulates COPII assembly and Golgi size. (A–F) Stable HeLa cell lines expressing T2-GFP were paraformaldehyde-fixed and analyzed to reveal GFP fluorescence (A and D) and Sec13 staining (B and E), each shown as Z axis projections of optical sections, as well as giantin staining (C and F) shown after 3D rendering. Control cells were those that expressed little or no detectable expression, whereas T2-GFP–overexpressing cells yielded strong Golgi and detectable ER staining. Bars, 10 μm. (G) COPII assembly and Golgi size were quantified for control and overexpressing T2-GFP cells. Values are normalized means (± SEM; n = 4; >25 cells each). Golgi size was total volume occupied by above-threshold fluorescence of giantin divided by apparent cell volume and showed a significant increase in T2-GFP–overexpressing cells. (H) COPII assembly level and the Golgi/cell size ratio were also compared on a cell-by-cell basis for single experiments. The correlation plot yielded a slope of 0.2.

