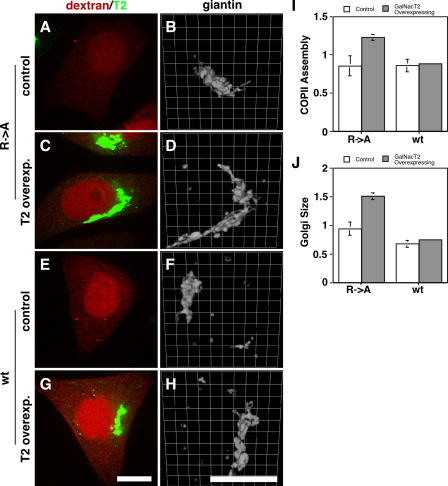
Figure 9.
Sar1p–GalNAcT2 interaction underlies Golgi size increase. (A–H) HeLa cells stably transfected with T2-GFP were microinjected with the alanine-substituted control peptide (A–D; R→A) or the GalNAcT2 cytoplasmic domain peptide (E–H; wild type [wt]) at 1 mM in the presence of fluorescent dextran as a microinjection marker. After 45 min, the cells were paraformaldehyde-fixed and analyzed to reveal dextran and GFP fluorescence (red and green, respectively; A, C, E, and G), as well as giantin staining shown after 3D rendering (B, D, F, and H). Control cells were those that exhibited little or no detectable expression, whereas T2-GFP–overexpressing cells yielded strong Golgi and detectable ER staining. Bars, 10 μm. (I and J) COPII assembly (I) and Golgi size (J) were then quantified for all control or T2-GFP–overexpressing microinjected cells. Values are normalized means (± SD; n = 2; ≥12 cells each). Note that the GalNAcT2 peptide, but not the control peptide, blocked both the up-regulation of COPII assembly and the increase in Golgi size induced by T2-GFP.

