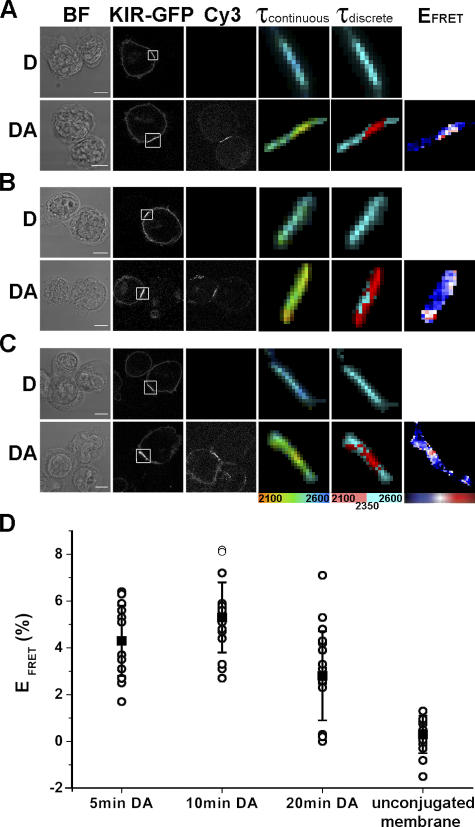
Figure 2.
KIR2DL1 phosphorylation is sustained at the inhibitory NK cell IS. YTS/KIR2DL1-GFP cells were coincubated with 221/Cw6 for 5 min (A), 10 min (B), or 20 min (C) and then fixed and stained with Cy3-labeled anti-phosphotyrosine mAb. Images show the fluorescence lifetime (within the area of the IS; white box) mapped to a continuous scale (τcontinuous; 2,100–2,600 ps) or a discrete scale (τdiscrete), where the breakpoint at 2,350 ps corresponds to 5% EFRET. FRET efficiencies were calculated for each pixel as EFRET (%) = 1 − τDA/τD × 100, where τDA is the fluorescence lifetime of the donor in the presence of the acceptor and τD is the mean fluorescence lifetime of the donor in the absence of the acceptor (unstained controls). Color scale shown covers EFRET 0–15% for 5 and 10 min and 0–10% for 20 min. Images shown are representative of at least three experiments and a total of 15–20 cell conjugates imaged in each condition. Bars, 8 μm. (D) Mean EFRET ± SD at the IS or in the unconjugated membrane for each cell conjugate were calculated, where τDA is the mean fluorescence lifetime of the donor at the IS in the presence of the acceptor and τD is the mean fluorescence lifetime of the donor at the IS in the absence of the acceptor (unstained controls).

