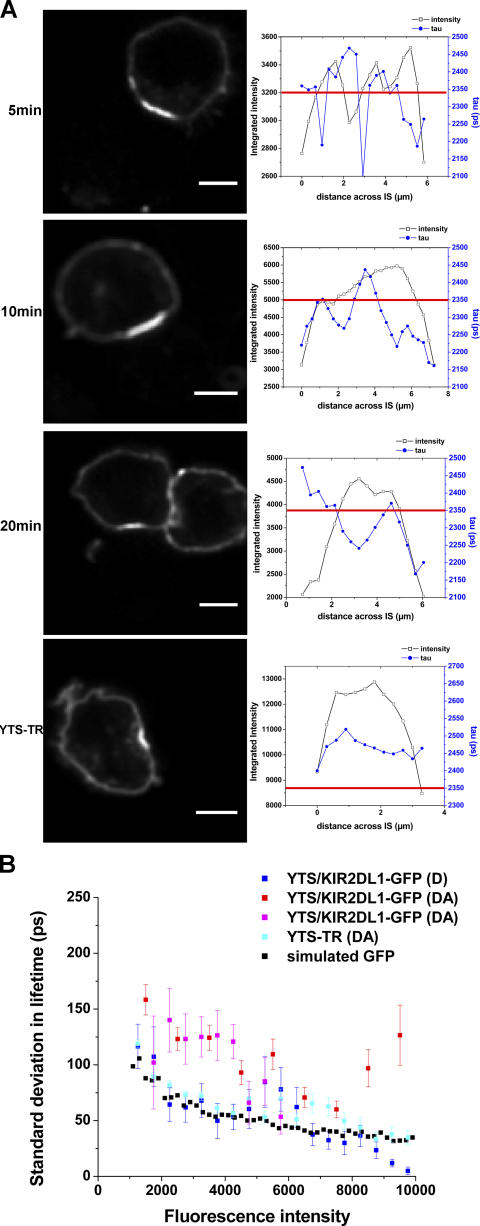
Figure 4.
KIR phosphorylation occurs in discrete microclusters. (A) KIR2DL1-GFP fluorescence intensity and fluorescence lifetime were analyzed across the region of clustered KIR (left) by plotting (right) the intensity (black line, left scale) and fluorescence lifetime (blue line, right scale) for each pixel across the synapse. For reference, the lifetime representing where 5% FRET efficiency occurred for each sample is also depicted (red line). Data shown are for YTS/KIR2DL1-GFP cells coincubated with 221/Cw6 for 5, 10, or 20 min, or YTS-TR cells. Data are representative of at least three experiments and a total of 15–20 cell conjugates imaged in each condition. (B) SD in fluorescence lifetime as a function of intensity for a simulated GFP dataset and representative cell conjugates of YTS/KIR2DL1-GFP and 221/Cw6 (D and two examples of DA) or YTS-TR and 221/Cw6 (DA). Bars, 8 μm.

