Figure 7.
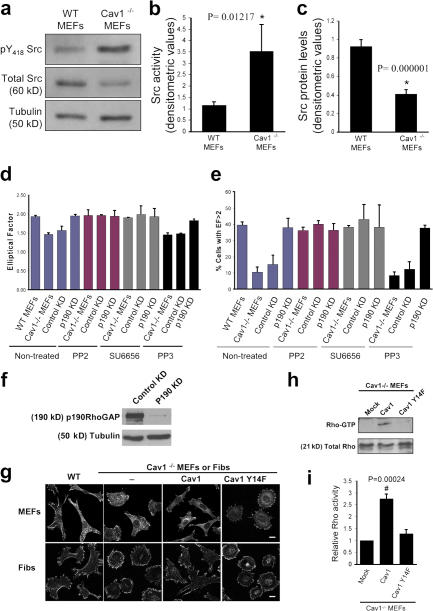
Altered phenotype of Cav1−/− fibroblasts is dependent on Src and p190RhoGAP. (a) Activated and total Src were assayed by Western blotting with anti-Src(pY418) phosphospecific antibody and anti-Src pan antibody, respectively. Each of the illustrated blots is representative of five experiments. (b) Src activity was determined densitometrically and expressed as the Src(pY418)/Src ratio. (c) Src protein levels were normalized to tubulin levels in each sample. Values depict means ± SEM of five independent experiments. (d) Both Src inhibition and p190RhoGAP knockdown in Cav1−/− MEFs restore the WT morphology pattern. EF was calculated for Cav1−/− MEFs treated with two different Src inhibitors, PP2 and SU6656. PP3 was used as a negative control. Data indicate means ± SEM (n = 3). (e) Percentages of cells with EF >2 are shown for each population (n >100 cells per condition). Values represent means ± SEM from three independent experiments. (f) Cav1−/− MEFs were infected with retroviruses encoding for control (control KD) or p190RhoGAP shRNA (p190 KD). Positive cells were sorted, and knock down was confirmed by a Western blot against p190RhoGAP. As a loading control, anti-tubulin immunoblot is shown. 95% reduction in p190RhoGAP levels was obtained. (g) Cells were plated on Fn-coated plates for 4 h, fixed, and stained with anti-paxillin antibodies. Representative images of each cell line are shown. Fibs, thymus fibroblasts. Bars, 20 μm. (h) Cav1−/− MEFs reconstituted with empty vector (mock), caveolin-1, or caveolin-1 Y14F were lysed, and pull-down assays were performed as described in Materials and methods. Proteins bound to GST-Rhotekin binding domain (top) and whole cell lysates (bottom) were separated on a 13% SDS-PAGE, transferred to a polyvinylidene difluoride membrane, and immunoblotted with anti-Rho antibodies. (i) The histograms illustrate densitometric analysis of the relative activity of Rho normalized for whole cell lysates and relative to control cells. Means ± SEM of six independent experiments are shown. #, Statistically significant versus Cav1−/− MEFs transfected with the empty vector.

