
Figure 8.
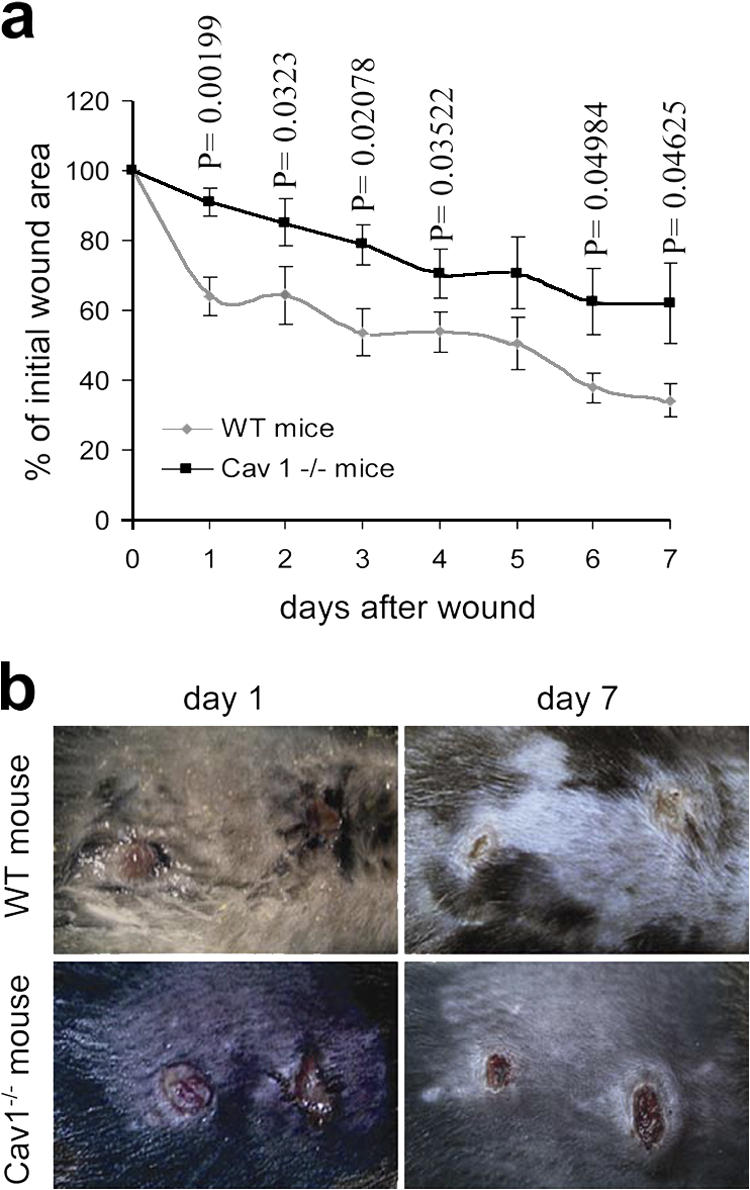
Wound healing in skin of WT and Cav1−/− mice. Two wounds were created per mouse in five Cav1−/− mice and five WT mice (n = 10). (a) The graph represents the percentage of initial wound area left at the indicated days after the punch was made (mean ± SEM). Statistical analysis shows that the healing rate is significantly different between genotypes 1–4, 6, and 7 d after wound creation (p-values). (b) Representative images of wounds 1 and 7 d after wound creation are shown.