Figure 1.
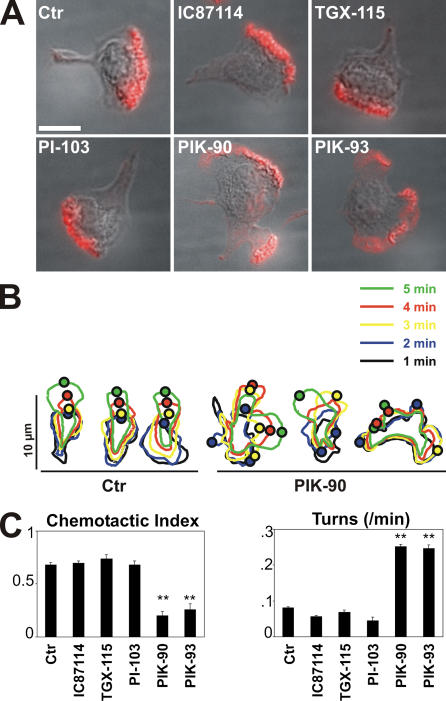
Effects of PI3K inhibitors on polarity and chemotaxis. (A) Cellular distribution of F-actin. Cells in suspension were exposed for 40 min either to no drugs, to 10 μM IC87114 or TGX-115, or to 1 μM PI-103, PIK-90, and PIK-93, allowed to stick to coverslips for 15 min, and treated with 100 nM fMLP for 3 min before fixation and staining for F-actin (red), as described in Materials and methods. Fluorescent and differential interference contrast images are merged. (Note that fMLP induced the formation of more than one leading edge in the individual cells shown for PIK-90 and -93, but this effect was not seen in all cells; see Results and Table S3) Bar, 10 μm. (B) Outlines of cells responding to stimulation with a uniform concentration of 100 nM fMLP. Cells were treated with or without 1 μM PIK-90 before treatment with fMLP. Each set of outlines represents a single cell observed at 1-min intervals (denoted by colors as indicated) after exposure to fMLP. Each small circle represents the center of a protruding lamellum at the periphery of each cell at the indicated time. Outlines on the left or right represent three control (Ctr) or three PIK-90–treated cells, respectively. Time-lapse videos of representative control or PIK-90–treated cells are shown in the supplemental material (Videos 1 and 2, respectively). (C) CI (left) and turning frequency of cells treated with the compounds indicated. Each bar represents the mean + one SEM (error bars) of different numbers of cells that were tested in multiple experiments: 30 control cells and 20, 10, 10, 29, and 18 cells for the compounds IC87114, TGX-115, PI-103, PIK-90, and PIK-93, respectively; concentrations of the same compounds were 10, 10, 0.5, 0.5, and 0.5 μm, respectively. Asterisks indicate that the value for cells treated with the compound differs from the corresponding control by P < 0.001. Trajectories of chemotaxing cells treated with two of these inhibitors are shown in Fig. S2 C (available at http://www.jcb.org/cgi/content/full/jcb.200604113/DC1).

