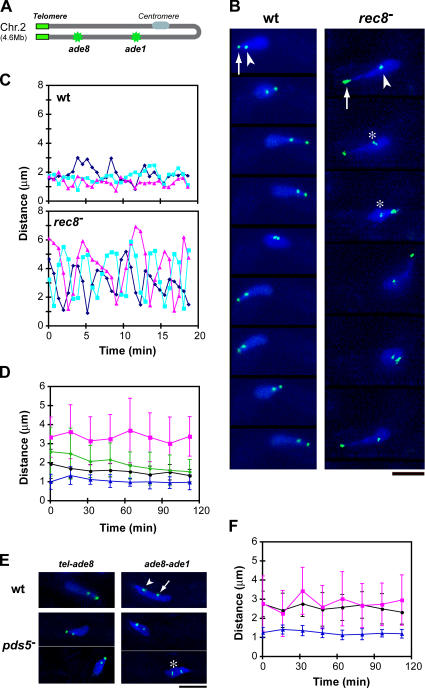
Figure 2.
Meiotic prophase chromosome compaction. (A) Schematic drawing showing the position of lacO inserts (green) in chromosome II with the telomeres clustered. (B) Time-lapse images of living wild-type and rec8 − cells. DNA was stained with Hoechst 33342 (blue). Green spots represent telomeres stained with Taz1-GFP (arrows) and the ade8 locus stained with lacO/lacI-GFP (arrowheads). Slight separation of sister chromatid loci is seen in the rec8 − cell (asterisks). (C) Distance between the telomere and the ade8 locus in examples of three individual cells. Time 0 represents the start of observations. (D) Changes in the telomere to ade8 distance during meiotic prophase in wild-type (black circle), rec8 − cells (magenta square), rec11 − cells (green diamond), and pds5 − cells (blue triangle). The distance was measured during a 2-min period every 15 min: values were obtained only when the nucleus was moving straight in either direction (not making a turn) and averaged from 10–20 measurements from 10 cells at each time point. The error bars indicate standard deviations. Time 0 represents the start of meiotic prophase, when karyogamy has just finished. (E) Chromosome compaction in pds5 − mutants. DNA was stained with Hoechst 33342 (blue). The green spots in left panels are telomeres and the ade8 locus, as in B. The green spots in the right panels are the ade8 locus (arrowhead) and the ade1 locus (arrow). Slight separation of sister chromatid loci in a pds5 − cell is indicated by an asterisk. (F) Changes in the ade8 to ade1 distance during meiotic prophase in wild-type (black circle), rec8 − cells (magenta square), and pds5 − cells (blue triangle). Bars, 5 μm.

