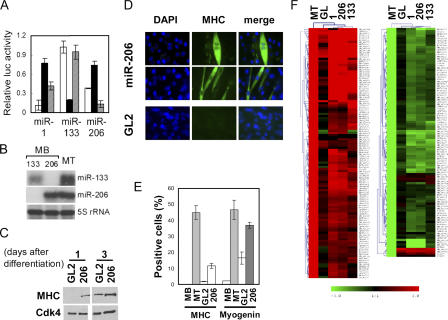
Figure 2.
The muscle-specific miRNAs induce the differentiation of MBs by regulating many genes. (A) Synthetic oligonucleotides complementary to miR-1, -133, and -206 were inserted downstream of Renilla luciferase ORF in pRL-CMV(MCS) to generate pRL1, pRL133, and pRL206, respectively. Luciferase assays were performed with pRL1 (white bar), pRL133 (black bar), and pRL206 (hatched bar) with the cotransfected RNA duplexes mimicking the miRNAs miR-1, -133, and -206, respectively (x axis). Sequential transfection of each RNA duplex (or miR-125b duplex as a control) and reporter plasmids in GM (serum+) was followed by luciferase assays 20 h after transfection. The y axis indicates relative Renilla luciferase activity, which is normalized as described in Materials and methods. (B) RNase protection assays were performed to measure the level of miR-133 (top) and -206 (middle), in MB transfected with the siRNA duplexes mimicking miR-133 or -206. 5S rRNA was used as a loading control (bottom). RNA from differentiated MTs is shown for comparison. (C) Immunoblots at the indicated days after the serum depletion of C2C12. C2C12 was transfected four times at 24-h intervals with miR-206 or GL2 negative control duplex before serum depletion. (D) C2C12 was transfected with miR-206 and GL2 as described in C, split at 5 × 10⁵ cells per well in a 6-well plate, and maintained in GM (serum+) for 3 d before immunostaining for MHC. The density of the cells can also be gauged in Fig. S1 B (available at http://www.jcb.org/cgi/content/full/jcb.200603008/DC1). (E) Quantification of MHC and myogenin expression in experiments as in D. MB, C2C12 MB in GM (serum+); MT, MT in DM (serum−); GL2 or 206, C2C12 in GM transfected with GL2 or miR-206 duplexes, respectively. Each value is a mean of triplicate. (F) Hierarchical cluster and heat map to show changes in mRNA relative to MBs in GM. Red and green represent increase and decrease of expression, respectively. Each row represents a single gene in the microarray. MT indicates C2C12 differentiated by serum deprivation, and other rows show C2C12 in GM transfected with the indicated duplexes. The 109 or 92 genes most up- or down-regulated after muscle differentiation are shown.

