Figure 1.
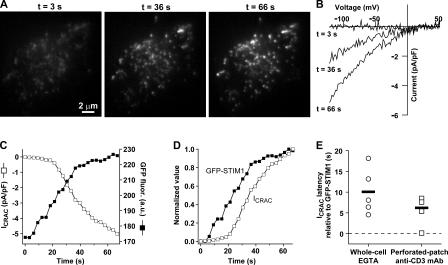
STIM1 accumulates near the plasma membrane before CRAC channels open. (A) Jurkat cell expressing GFP-STIM1 imaged by TIRF microscopy during whole-cell recording with a pipette solution containing 1 mM EGTA. As stores become depleted, GFP-STIM1 redistributes into puncta near the plasma membrane as shown at the indicated times. (B) CRAC currents elicited by voltage ramps from −122 to +50 mV during the image acquisitions shown in A. Data were corrected for the leak current recorded at t = 0 s and expressed relative to cell size (capacitance). (C) Time courses of ICRAC development (measured at −122 mV) and GFP-STIM1 fluorescence (averaged across the entire cell footprint). (D) To compare the time courses of ICRAC activation and GFP-STIM1 fluorescence, the data from C were normalized to the same minimum and maximum values. (E) Accumulation of GFP-STIM1 near the plasma membrane precedes CRAC channel activation. The difference in times for ICRAC and GFP-STIM1 fluorescence to reach 20% of their maximum values is plotted for individual cells in response to passive depletion during whole-cell recording (left) or IP3-induced Ca2+ release during perforated-patch recording (right). IP3-induced Ca2+ release was triggered by cross-linking TCR with anti-CD3 mAb. The individual latencies (open circles; n = 5 cells) and mean latency (black bar) of 10 ± 2.5 s during passive depletion was comparable to the individual latencies (open squares; n = 4 cells) and mean latency (black bar) of 6.2 ± 1.8 s during IP3-induced Ca2+ release. The difference in the means was not statistically significant (t test: P = 0.28). The complete image and ICRAC sequences for A–D are shown in Video 2 (available at http://www.jcb.org/cgi/content/full/jcb.200604014/DC1). An individual cell response to TCR cross-linking is shown in Fig. S1.

