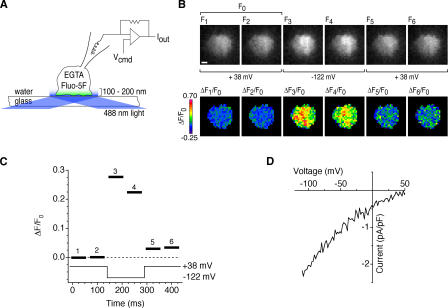
Figure 1.
A method for visualizing active CRAC channels. (A) TIRF imaging during whole-cell recording from a single Jurkat cell. EGTA and fluo-5F are introduced into the cell through the recording pipette. TIRF illumination restricts the excitation of fluo-5F to within ∼200 nm of the coverslip, and EGTA suppresses increases in global [Ca2+]i while it depletes Ca2+ stores. The patch-clamp command voltage (Vcmd) controls the driving force for Ca2+ entry through open CRAC channels. (B) Fluo-5F fluorescence images show a rapid, reversible fluorescence increase during a voltage step from +38 to −122 mV. ΔF/F0 images (bottom) were calculated by normalizing raw fluorescence images (top) to the mean of two control images collected at +38 mV (F0). Bar, 2 μm. (C) ΔF/F0 values averaged over the cell footprint (black bars) for each ratiometric image. ΔF/F0 values change within 10–60 ms of changes in membrane potential. The bar width indicates the camera exposure time. (D) Current evoked by voltage ramps from −122 to +50 mV during the experiment, showing the inward rectification typical of ICRAC.

