Figure 2.
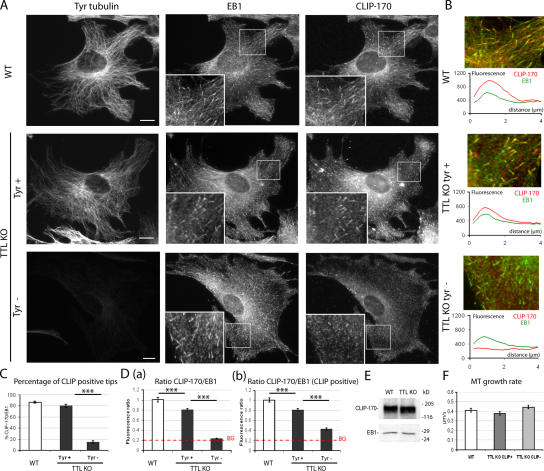
CLIP-170 localization in WT or TTL-null fibroblasts. (A) Triple staining of Tyr tubulin, EB1, and CLIP-170 in WT or TTL-null (TTL KO) fibroblasts. MT ends were identified by EB1 labeling. In WT cells, CLIP-170 and EB1 colocalized at MT ends. TTL-null fibroblasts showed several patterns of CLIP-170 distribution depending on Tyr tubulin levels: Tyr+ cells showed CLIP-170 comets at most MT ends, whereas Tyr− cells lacked detectable CLIP-170 comets. Bars, 10 μm. (B, top) High magnification of a region of interest from WT or TTL-null fibroblasts. Merged images show CLIP-170 in red and EB1 in green. Colocalization is shown in yellow. (bottom) Graph of the line scan of fluorescence intensity (arbitrary units) of CLIP-170 (red) and EB1 (green), starting at the end of the MT (distance 0) to 4 μm inwards. (C) Quantitative analysis of CLIP-170 localization in WT or TTL-null fibroblasts. Mean values ± SEM of the percentage of CLIP-170+ ends among EB1 MT ends (% CLIP-170/EB1) in WT (n = 37), TTL-null Tyr+ (n = 30), and TTL-null Tyr− cells (n = 41), respectively. ***, P < 0.001 (t test). Less than 15% of MT ends were detectably labeled with CLIP-170 antibody in Tyr− cells, whereas the proportion of CLIP+ ends was never <80% in WT or in TTL-null Tyr+ cells. (D) Fluorescence ratios of CLIP-170 and EB1 in WT or TTL-null fibroblasts. (a) For each cell type, 90 EB1+ comets were chosen, and mean fluorescence intensities were measured for EB1 and CLIP-170. Background signal (BG) corresponded to the mean fluorescence intensity of a straight line drawn across a Tyr− cell. (b) Same as panel a, restricting the analysis to MT ends scored as CLIP+ in WT (n = 90), TTL-null Tyr+ (n = 90), and TTL-null Tyr− (n = 56) cells. Even when CLIP-170 comets were visible, CLIP-170 signal was markedly diminished in TTL-null cells compared with WT cells. (E) Western blot analysis of CLIP-170 and of EB1 content in WT or TTL-null fibroblast extracts. Equal amounts of proteins were loaded in each line. (F) MT growth rate measurement in WT or TTL-null cells (mean ± SEM). Cells were double transfected with GFP–CLIP-170 and EB3-RFP cDNAs. In all cells, MT ends were decorated with EB3-RFP, and the velocity of MT growth was measured using video microscopy. TTL-null cells were classified as CLIP+ when the percentage of CLIP-170/EB3 was ≥40% or as CLIP− when the percentage of CLIP-170/EB3 was ≤15%. WT ends, n = 70; TTL-null CLIP+ ends, n = 70; TTL-null CLIP− ends, n = 84. See Videos 1–3, available at http://www.jcb.org/cgi/content/full/jcb.200512058/DC1.

