Figure 7.
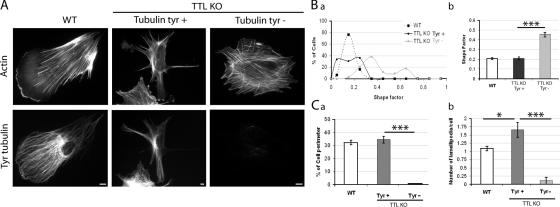
Morphological analysis of WT or TTL-null fibroblasts. (A) Double staining of actin and Tyr tubulin in WT or TTL-null (TTL KO) fibroblasts. WT cells often showed a polarized morphology with a large lamellipodium. Tyr+ TTL-null fibroblasts often displayed two or more lamellipodia. In contrast, Tyr− TTL-null fibroblasts lacked distinct polarization. Bars, 10 μm. (B) The graph depicts morphology. A shape factor (4π area/perimeter2) was determined in WT or TTL-null fibroblasts. (a) Shape factor distribution in WT (n = 43), TTL-null Tyr+ (n = 36), or TTL-null Tyr− fibroblasts (n = 34). (b) Shape factor mean values ± SEM. Compared with WT or Tyr+ TTL-null fibroblasts, Tyr− TTL-null cells exhibited a significant increase in the shape factor. ***, P < 0.001 (t test). (C, a) Quantitative analysis of the percentage of cell perimeter occupied by lamellipodia in WT, Tyr−, or Tyr+ TTL-null cells. (b) Number of lamellipodia per cell in WT, Tyr−, or Tyr+ TTL-null cells. Tyr− TTL-null cells often displayed no lamellipodia extensions. In contrast, Tyr+ TTL-null cells exhibited an increased number of large lamellipodia extensions compared with WT fibroblasts (WT, n = 68; Tyr−, n = 20; Tyr+, n = 38). ***, P < 0.001; *, P < 0.05 (t test).

