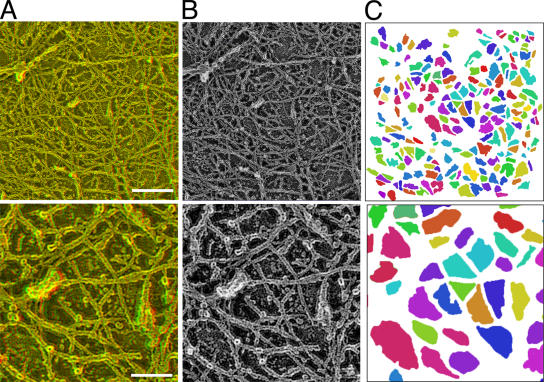
Figure 7.
The MSK meshwork directly on the cytoplasmic surface of the plasma membrane. The central parts of the figures in the top row (bar, 300 nm) are magnified by a factor of three and are shown in the bottom row (bar, 100 nm). (A) Typical stereo views of the plasma membrane specimen (anaglyph; left = red). (B) Normal electron micrographs of the plasma membrane samples. The same view fields as those in A. (C) The areas delimited by the actin filaments closely apposed to the cytoplasmic surface of the cell membrane are shown. Different colors are shown to help the eye.

