Figure 3.
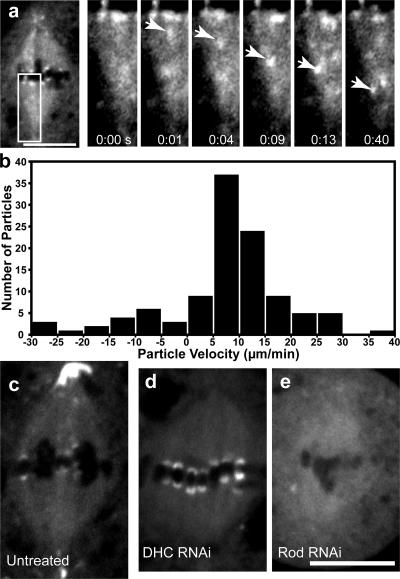
GFP-Spindly is moved from kinetochores toward the spindle pole in a dynein-dependent manner. (a) By live cell microscopy, a particle of GFP-Spindly (arrows in the insets [magnified images of the boxed area]) can be seen moving from the kinetochore to the centrosome. The seconds elapsed are shown at the bottom (see Video 4, available at http://www.jcb.org/cgi/content/full/jcb.200702062/DC1). (b) Kymograph analysis was performed on the GFP-Spindly particles, and a histogram of the rates of 110 GFP-Spindly particles during episodes of continuous motion was produced (data were obtained from four separate spindles). The mean speed was 11.9 ± 6.9 μm/min (±SD). (c–e) GFP-Spindly in live cells was imaged by spinning disc confocal microscopy in untreated (c), dynein (DHC) RNAi-treated (d), or Rod RNAi-treated (e) cells. Dynein depletion caused Spindly to accumulate at high levels on aligned kinetochores, whereas Rod depletion blocked the recruitment of Spindly to the kinetochore. Bars, 5 μm.

