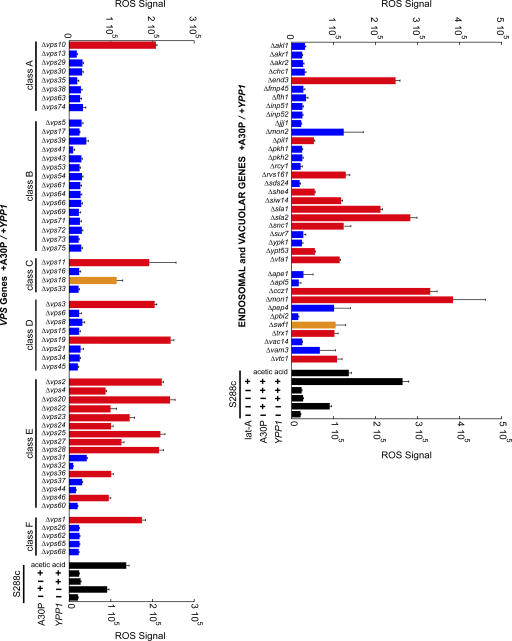
Figure 6.
Screening for genes that interact withYPP1. The indicated deletion strains transformed with pTF302 (A30P) and pTF602 (YPP1) were pregrown in noninducing media to mid-log phase, transferred to inducing media, and induced for 3 h. Matched controls consisted of identically treated S288c cells transformed with the same two plasmids. The dye DHR 123 was added at 2 h after induction. After several washing steps, cells were aliquoted into 96-well plates and the DHR 123 fluorescent product was detected using a plate reader. Cells incubated in dilute acetic acid exhibit ROS (Ludovico et al., 2002), and this served as a positive control. Latrunculin A was used at 25 μM. Experiments were performed in two to five independent experiments, each in triplicate. Bars indicate mean ROS signal ± SD. Comparing each deletion strain to matched controls (S288c +A30P/+Ypp1) yielded P-values: red, P < 0.001; orange, P < 0.05; and blue, P > 0.05. Exact P values are given in Table S1 (available at http://www.jcb.org/cgi/content/full/jcb.200610071/DC1).

