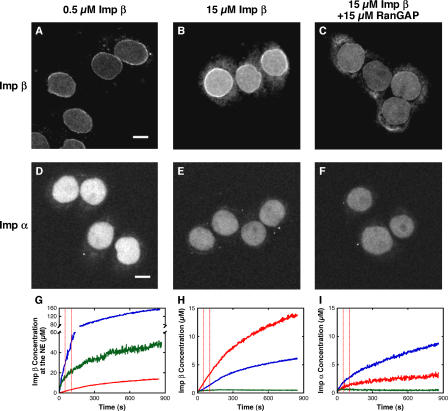
Figure 5.
Imp α and β accumulation in the nucleus and at the NE. Unless noted at the top, concentrations were the same as in Fig. 1. Images shown in A–F are the average of 101 confocal frames collected between 600 and 800 s after reaction initiation. (A–C) Nuclear accumulation of fluorescent Imp β. Images were acquired under the same conditions and are displayed with the same scaling. (D–F) Nuclear accumulation of fluorescent Imp α. Images were acquired under the same conditions and are displayed with the same scaling (scaling different from A–C). Bars, 10 μm. (G) Time course of the NE accumulation of Imp β under the conditions of A (red), B (blue), and C (green). (H and I) Time course of the Imp β and α distribution under the conditions of A and D, respectively. The fluorescence intensity in the nuclear (blue), NE (red), and cytoplasmic (green) regions shows minimal NE accumulation of Imp α but significant NE accumulation of Imp β, compared with the cytoplasmic background. The estimated NE accumulation of Imp α could result primarily from the difficulty of distinguishing the nucleoplasm from the NE. The vertical dashed lines (red) in G–I indicate the time interval during which single-molecule transport experiments were conducted (unless otherwise noted).

