Figure 8.
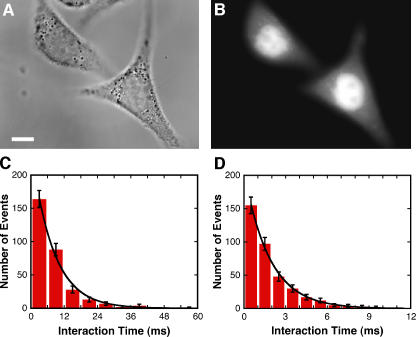
In vivo single-molecule nuclear import. (A) Bright-field image of two HeLa cells before microinjection. Bar, 10 μm. (B) Epifluorescence image of the two cells in A ∼3 min after cytoplasmic microinjection of NLS-2xGFP(4C). The Alexa 555–labeled cargo localized to the nuclei after microinjection. (C) Histogram of NE interaction times after microinjection of NLS-2xGFP(4C). Data were pooled from cargo tagged with Alexa 555 and cargo labeled with Alexa 647 (see Table S1, available at http://www.jcb.org/cgi/content/full/jcb.200605053/DC1). τ = 7.8 ± 0.4 ms (n = 307); import efficiency = 51 ± 5% (n = 115). (D) Histogram of NE interaction times after microinjection of Alexa 647 dextran (10 kD). τ = 1.8 ± 0.1 ms (n = 374); import efficiency = 50 ± 4% (n = 141).

