Figure 6.
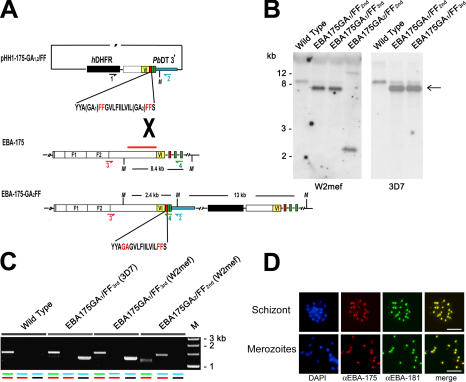
Mutation of the PfROM4 recognition motif within the EBA-175 TMD is deleterious. (A) Scheme showing the replacement of the 3′ region of the eba-175 gene by single-crossover integration of pHH1-175-GA1,2/FF constructs. The positive selection cassette (hDHFR) of the pHH1 vector is represented by a black box. A ∼1-kb fragment of eba-175 cDNA including sequence encoding region VI (yellow), the mutant TMD (red), and the cytoplasmic domain (green) was cloned into vector pHH1, flanked by the 3′ UTR of the Plasmodium berghei dihydrofolate reductase gene (blue) to ensure correct transcription termination and polyadenylation of the modified gene. The intron-exon structure of the eba-175 gene is shown (gray; signal peptide). MfeI restriction enzyme sites are indicated (M). Relative positions of oligonucleotides used in the PCR analysis (1, primer HH1-S; 2, primer HH1-AS; 3, primer 1753259-S; 4, primer 175-ASstop; see Table S2, available at http://www.jcb.org/cgi/content/full/jcb.200604136/DC1) are shown as colored arrows, and the position of the probe used for Southern analysis is indicated by the red bar. (B) Southern blot of gDNA from parental and transgenic parasites (MfeI restricted) reveals integration of pHH1-175-GA2/FF but not pHH1-175-GA1/FF into the eba-175 locus. The endogenous eba-175 hybridizing fragment (8.4 kb) is present in the W2mef and 3D7 EBA175GA1/FF lines at both the second and third cycles of drug selection but disappears upon integration of the plasmid in the W2mef EBA175GA2/FF transgenic line; the 2.4- and 13-kb hybridization bands indicate replacement as expected of the 3′ end of the eba-175 gene by the second drug selection cycle. Sizes of hybridizing bands are shown, and the band corresponding to free episome is marked by an arrow. (C) PCR analysis of the eba-175 locus using gDNA from parental and transgenic parasite lines. Molecular mass markers are shown (M). Amplification from the eba-175 locus is displayed for each parasite line using three different oligonucleotide primer combinations: 1 plus 2 (black and blue; plasmid specific), 3 plus 4 (red and green; eba-175 specific), and 2 plus 3 (blue and red; eba-175 single-crossover specific). (D) IFA localization of mutant EBA-175 in transgenic EBA175GA2/FF W2mef schizonts and free merozoites. Antibodies specific for EBA-175 (red) and EBA-181 (green) colocalize in the merged image. The DAPI signal (blue) is not included in the merge. Bars, 5 μm.

