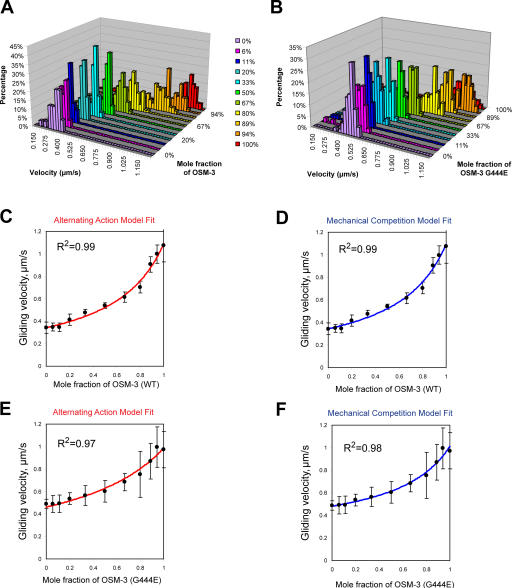
Figure 2.
MT gliding rate versus mole fraction for mixtures of OSM-3 and kinesin-II showing alternating action and mechanical competition model fits. (A and B) Velocity histograms of gliding rates in competitive motility assays as a function of the percentage of wild-type OSM-3 (A) and OSM-3–G444E mutant (B) versus kinesin-II. Between 0 and 100% OSM-3, gliding rates intermediate between those produced by each motor alone are observed. (C and D) Gliding assay plotted versus mole fraction of wild-type (WT) OSM-3. Experimental data (black dots) with standard deviations (error bars) are shown with best fits for the alternating action (red line; C) and the mechanical competition (blue line; D) models. The parameters are as follows: v
kinesin-II = 0.34 μm/s and v
osm-3 = 1.09 μm/s (C); and  ,
,  , and γ = 0.98 ≈ 1 (D). (E and F) Gliding assay velocities plotted versus mole fraction of OSM-3–G444E. Experimental data (black dots) with standard deviations are shown with the best fit for the alternating action (red line; E) and the mechanical competition (blue line; F) models. The parameters are as follows: v
kinesin-II = 0.46 μm/s and v
osm-3 = 0.99 μm/s (E); and
  ,
,  , and γ = 0.7 (F).

