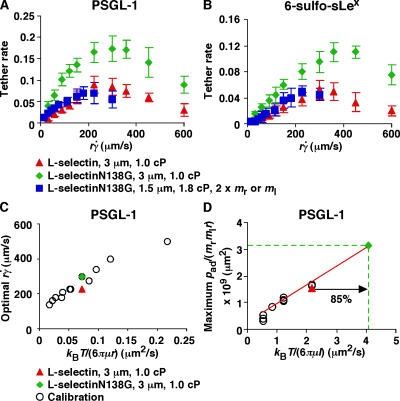
Figure 2.
Effects of interdomain hinge flexibility on flow-enhanced tethering. (A and B) Tether rates of microspheres of indicated radii bearing either L-selectin or L-selectinN138G perfused in media of indicated viscosities were plotted against the product  , where r is the microsphere radius and
  is the wall shear rate. The microspheres were coated with 750 molecules μm−2 of either L-selectin or L-selectinN138G, except in one case in B, where they were coated with 1,500 molecules μm−2 of L-selectinN138G (blue squares). The flow chamber floor in A was coated with PSGL-1 at either 120 (red triangles and green diamonds) or 240 (blue squares) molecules μm−2. The flow chamber floor in B was coated with a constant density of 6-sulfo-sLex. The data in A and B represent the mean ± the SD from three experiments. (C) Optimal
  (peak locations of the p
ad/(m
r
m
l
r) vs.
  curves) versus microsphere diffusivity k
B
T/(6πμr) data for tethering to PSGL-1 (open circles; Yago et al., 2006) were replotted to provide calibration. The diffusivities of 3-μm radius microspheres bearing L-selectin (red triangle) or L-selectinN138G (green diamond) were plotted for comparison. (D) Maximum p
ad/(m
r
m
l
r) versus molecular diffusivity k
B
T/(6πμl) data for tethering to PSGL-1 (open circles; unpublished data) were replotted to provide calibration, which assumed the characteristic length for molecular diffusion as l = 100 nm. The same l value was used for the L-selectin datum (red triangle), which matched the calibration curve well. The l value for L-selectinN138G is predicted to be smaller. Using the measured maximum p
ad/(m
r
m
l
r) value, the L-selectinN138G datum point (green diamond) was located at the intercept of y = [p
ad/(m
r
m
l
r)] max (green dashed horizontal line) and the extrapolation of the calibration curve (red line). The increased molecular diffusivity for L-selectinN138G could be calculated from the x-axis value of this datum point (green dashed vertical line).

