Figure 5.
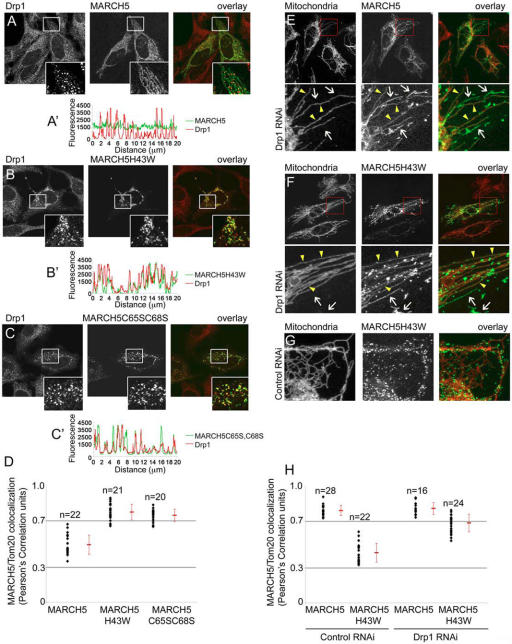
Drp1 colocalizes with mitochondrial complexes of MARCH5 RING mutants. Cells transfected with MARCH5-YFP (A; green), MARCH5H43W-YFP (B; green) and MARCH5C65S,C68S-YFP (C; green) were immunostained for Drp1 (red) and analyzed by confocal microscopy. The inserts in A–C show magnified fragments (white squares) of the respective cells. Relative fluorescence intensities of Drp1 (red lines) and MARCH5 variants (green lines) located in cell areas indicated in the respective images were measured using Zeiss LSM510 software (A′–C′). Note the high degree of the MARCH5 and Drp1 linescan overlap in MARCH5 RING mutant–expressing cells. The overall degree of Drp1 colocalization with different variants of MARCH5 was analyzed using the colocalization function of Volocity software (D). Values shown represent Pearson's Correlation units (see text). Drp1 RNAi (E, F, and H) and control RNAi (G and H) cells obtained as described previously (Lee et al., 2004), were transfected with MARCH5-YFP (E and H) and MARCH5H43W-YFP (F–H), immunostained for Tom20 to reveal the OMM (red in overlay images) and analyzed by confocal microscopy. The bottom panels in E and F show magnified fragments of cells indicated by red squares. Arrows indicate peroxisomes, arrowheads mitochondria. The association of MARCH5 and MARCH5H43W with Tom20 in control RNAi and Drp1 RNAi cells was quantified (H). The degrees of association are shown as Pearson's Correlation units (r).

