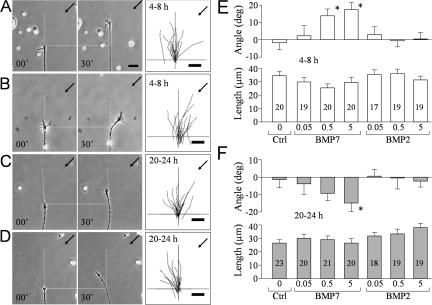
Figure 1.
Bidirectional responses of nerve growth cones to BMP7 at different times in culture. (A–D) Representative phase-contrast images showing the turning responses of Xenopus growth cones from 4–8-h cultures (A and B) or overnight (20–24 h) cultures (C and D) at the onset (0 min) and end of 30 min of exposure to a BMP7 gradient (5 μM in pipette; B and D) or a control saline (A and C). Only the growth cone and part of its adjacent neurite are shown in the image. Scattered yolk granules (small bright objects) are present in each image and can be used as fiduciary markers. Horizontal dotted lines show the position of the growth cone at the onset of the turning assay. Vertical dashed lines show the original trajectory of the growth cone (determined from the growth cone and the adjacent 20 μm of neurite). Arrows indicate the direction of the gradient. Numbers indicate the time after the onset of the gradient. The overall responses of all of the growth cones in each group are depicted by the composite tracings of the trajectory of neurite extension of each growth cone during the 30-min turning assay. The origin is the center of the growth cone at the onset of the gradient, and the original direction of growth cone extension is vertical. (E and F) Mean turning angles (top) and lengths of net growth cone extension (bottom) of different groups of growth cones examined in 4–8-h cultures (E) or 20–24-h cultures (F). BMP concentrations are shown as micromolars in the pipette. The numbers of growth cones examined for each condition are shown on the bars. Asterisks indicate significant differences from the corresponding control (*, P < 0.05; Mann-Whitney test). Error bars represent SEM. Bars, 20 μm.

