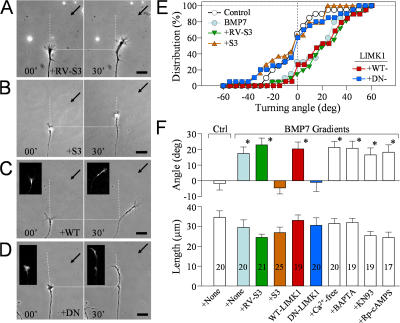
Figure 3.
LIMK mediates BMP7-induced attraction in 4–8-h neurons. (A and B) Representative images showing Xenopus growth cones from 4–8-h cultures at the onset (0 min) and end of a 30-min exposure to a BMP7 gradient (5 μM in pipette) with 10 μg/ml RV-S3 control peptide (A) or 10 μg/ml S3 peptide (B). (C and D) Representative images of growth cones from embryos expressing WT-LIMK1 (C) or DN-LIMK1 (D) at the onset (0 min) and end of a 30-min exposure to a BMP7 gradient (5 μM in pipette). The insets are the corresponding fluorescence of coinjected fixable FITC-dextran. (A–D) Horizontal dotted lines show the positions of the growth cone at the onset of the turning assay, and arrows indicate the direction of the gradient. Dashed lines show the trajectories of the growth cone at the onset of the assay. (E) Cumulative histograms showing the distribution of the turning angles for each condition. Each point represents the percentage of growth cones with final turning angles equal to or less than the values indicated on the abscissa. (F) Mean turning angles (top) and net extension (bottom) of different groups of growth cones examined in 4–8-h cultures. The numbers of growth cones examined for each condition are shown on the bars. For clarity, colors in E and F are matched to represent the same group of growth cones. Asterisks indicate significant differences from the corresponding control (*, P < 0.01; Mann-Whitney test). Error bars represent SEM. Bars, 20 μm.

