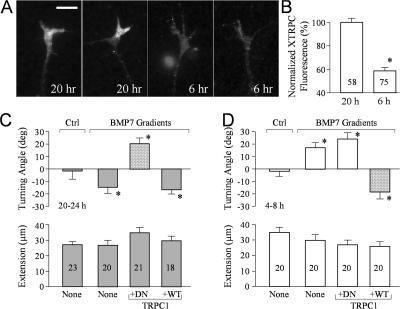
Figure 9.
Xenopus TRPC1 coupling the Ca2+–CaN–SSH pathway to BMP7 signaling for growth cone repulsion. (A) Representative fluorescence images of 6- or 20-h cultured Xenopus growth cones stained with a specific antibody against Xenopus TRPC1. (B) Normalized levels of Xenopus TRPC1 expression in Xenopus growth cones of 6- and 20-h cultures. The asterisk indicates statistical significance (*, P < 0.01; t test). (C and D) Mean turning angles (top) and lengths of net extension (bottom) of different groups of growth cones examined in overnight cultures (C) and 4–8-h cultures (D). The bars filled with a pattern show the turning responses switched from the original one (repulsion to attraction in overnight cultures and attraction to repulsion in 4–8-h cultures). Asterisks indicate significant differences from the corresponding control (*, P < 0.01 compared with the control). (B–D) The numbers of growth cones examined in each condition are shown on the bars. Error bars represent SEM. Bar, 10 μm.

