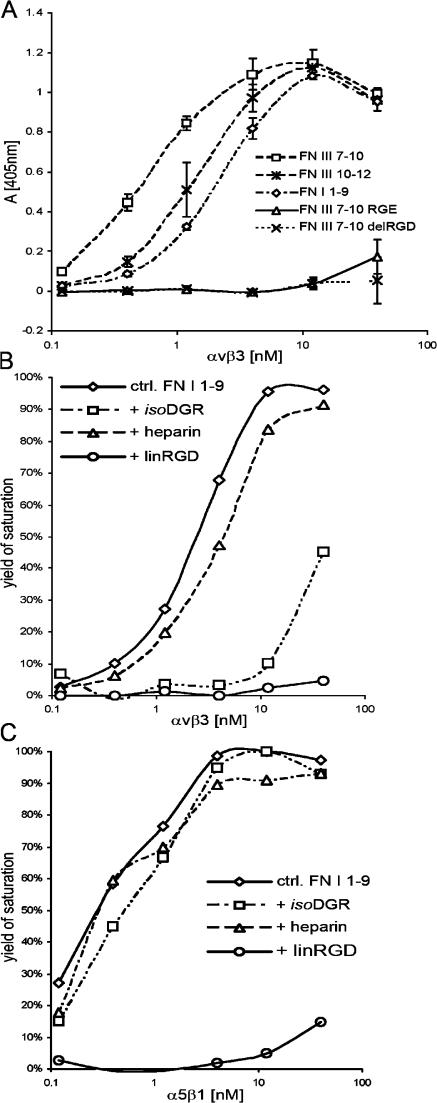
Figure 7.
Direct solid-phase FN and integrin binding assay. (A) Titration curve of αvβ3 integrin bound to different recombinant FN fragments. After blocking of nonspecific binding sites, αvβ3 was allowed to bind in TBS buffer containing 1 mM MnCl2. Mean ± SD (n = 3). Note that αvβ3 integrin bound with high affinity to FN-I1-9. (B) FN-I1-9 was immobilized at 0.25 μM. After blocking of nonspecific binding sites, αvβ3 was allowed to bind in TBS buffer containing 1 mM MnCl2 (diamonds) plus 100 μg/ml heparin (triangles), 750 μM isoDGR-2C (squares), or 850 μM linRGD peptide (circles). The values plotted are normalized to the maximal binding value to give the yield of saturation. Maximal binding of αvβ3 to FN-I1-9 corresponds to an OD (405 nm) value of 1.08. Note that αvβ3 binding to FN-I1-9 is inhibited by both linRGD and isoDGR-2C peptides. (C) The same experimental procedure was performed as described in B, with the exception that α5β1 integrin was used for titration. Maximal binding of α5β1 to FN-I1-9 corresponds to an OD (405 nm) value of 1.04. Note that α5β1 integrin binding to FN-I1-9 is inhibited by linRGD peptides but not by isoDGR-2C peptides. In all binding assays, the absorbance measured in BSA-coated wells was <15% relative to maximum absorbance values and was routinely subtracted. All binding was determined in duplicate.

