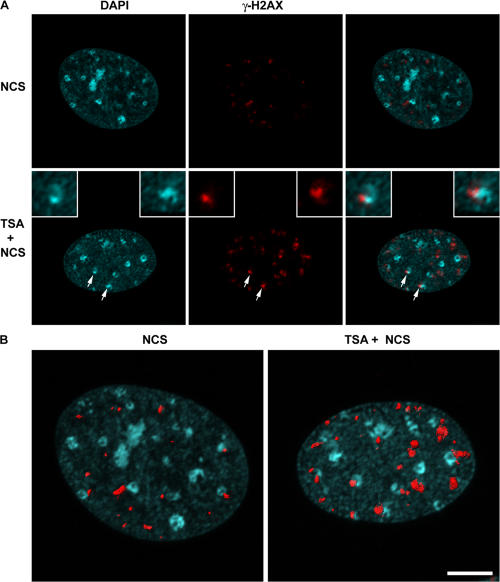
Figure 6.
Distribution of phosphorylated H2AX in mouse embryo fibroblasts containing hyperacetylated histones. γ-H2AX foci in wild-type cells treated with either NCS or TSA and NCS. Confocal image stacks through the depth of the cell nucleus (z axis) were collected with an optical slice thickness of 800 nm. (A) Representative single optical slice of γ-H2AX foci in NCS-treated (top) and TSA + NCS–treated (bottom) cells. Images were collected with identical imaging parameters and contrast adjustments (histogram stretching). Arrows denote two separate γ-H2AX foci adjacent to pericentric heterochromatin that are shown at higher magnification in the top left and right insets. (B) The same cell nucleus as in A but shown as a 3D volume reconstruction, with the surface rendering of individual foci shown in red superimposed on the DAPI image, which is shown in blue. Images were background subtracted, and volume reconstructions were generated using Imaris software, from which the volumes of individual foci were measured (see Materials and methods). Bar, 5 μm.

