Figure 6.
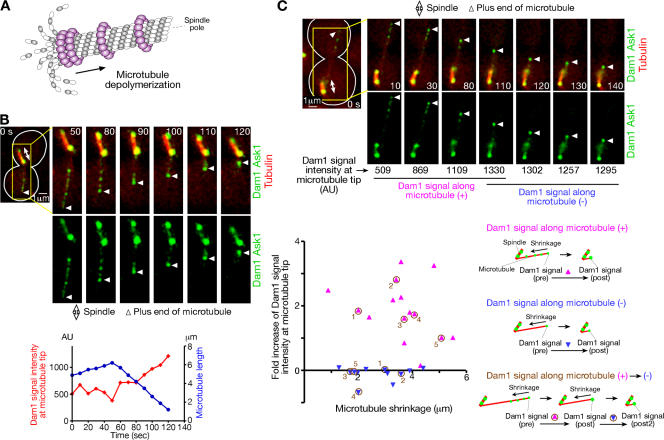
Localization of the Dam1 complexes at the microtubule plus end. (A) Schematic diagram of microtubule depolymerization and possible localization of the Dam1 complexes. (B) The Dam1 complexes accumulate at the end of a microtubule as it depolymerizes. (top) Representative time-lapse images of Dam1 complex localization during microtubule shrinkage. (bottom) Length of the microtubule (blue) and intensity of Dam1 and Ask1 GFP signals at the microtubule distal end (red). DAM1-4GFP ASK1-4GFP CFP-TUB1 PGAL-CEN3-tetOs TetR-3CFP PMET3-CDC20 cells (T4991) were treated as in Fig. 1 except that glucose-containing media were used throughout the experiment (i.e., CEN3 was continuously active). CFP (CEN3, tubulin; red) and GFP (the Dam1 complex; green) images were acquired every 10 s. AU, arbitrary unit. See Video 3. (C) The Dam1 complexes along a microtubule are collected at its plus end. T4991 cells were treated as in B. The Dam1 complex signal (Dam1-4GFP and Ask1-4GFP) at the microtubule plus end was quantified, and its fold increase during microtubule shrinkage was plotted against the extent of this shrinkage in the presence (pink) and absence (blue) of the Dam1 complexes along the microtubule. Fold increase was calculated by dividing the increase of the signal intensity (pre→post or post→post 2) by pre-signal intensity. Numbers in brown represent each microtubule in which the fold increase was measured consecutively (microtubule #3 is shown in the images). For more information, see supplemental note 31 (available at http://www.jcb.org/cgi/content/full/jcb.200702141/DC1).

