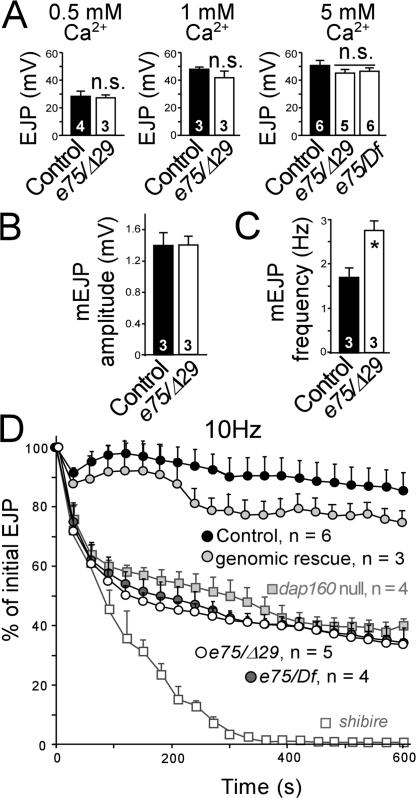
Figure 5.
eps15 mutants show normal neurotransmitter release when stimulated at low frequency but are unable to sustain release under high-frequency stimulation. (A) Mean EJP measured at the NMJ reveals that neurotransmitter release is normal at eps15e75/eps15Δ29 (e75/Δ29) and eps15e75/Df(2L)Dll-MP (e75/Df) during 0.1 Hz of stimulation (0.5 and 1 mM Ca2+) and single nerve stimulations (5 mM Ca2+). (B) Mean mEJP amplitudes recorded in 0.5 mM Ca2+ and 3 μM tetrodotoxin were not different between e75/Δ29 and w controls. (C) However, mean mEJP frequency of e75/Δ29 is higher than controls. (D) When stimulated at 10 Hz, eps15 mutant NMJs show defects in maintaining release. Specifically, the mean EJPs of both e75/Δ29 and e75/Df were significantly different from controls (P < 0.01) after 60 s. Introducing one copy of eps15 genomic fragment in the e75/Δ29 background rescued this defect (genomic vs. control, P > 0.1; genomic vs. e75/Δ29, P < 0.01). Note that the two different eps15-null transheterozygotes show defects that are similar to that of dap160 Δ1/Df(2L)bur-K1 (dap160 null) but less severe than that of shibirets1 (shibirets1 data is adapted from Koh et al. [2004] for comparison). w larvae were used as controls. *, P < 0.05 (controls vs. mutants; Mann-Whitney U-test). Error bars indicate SEM, and the numbers in histograms indicate the number of larvae.

