
Figure 4.
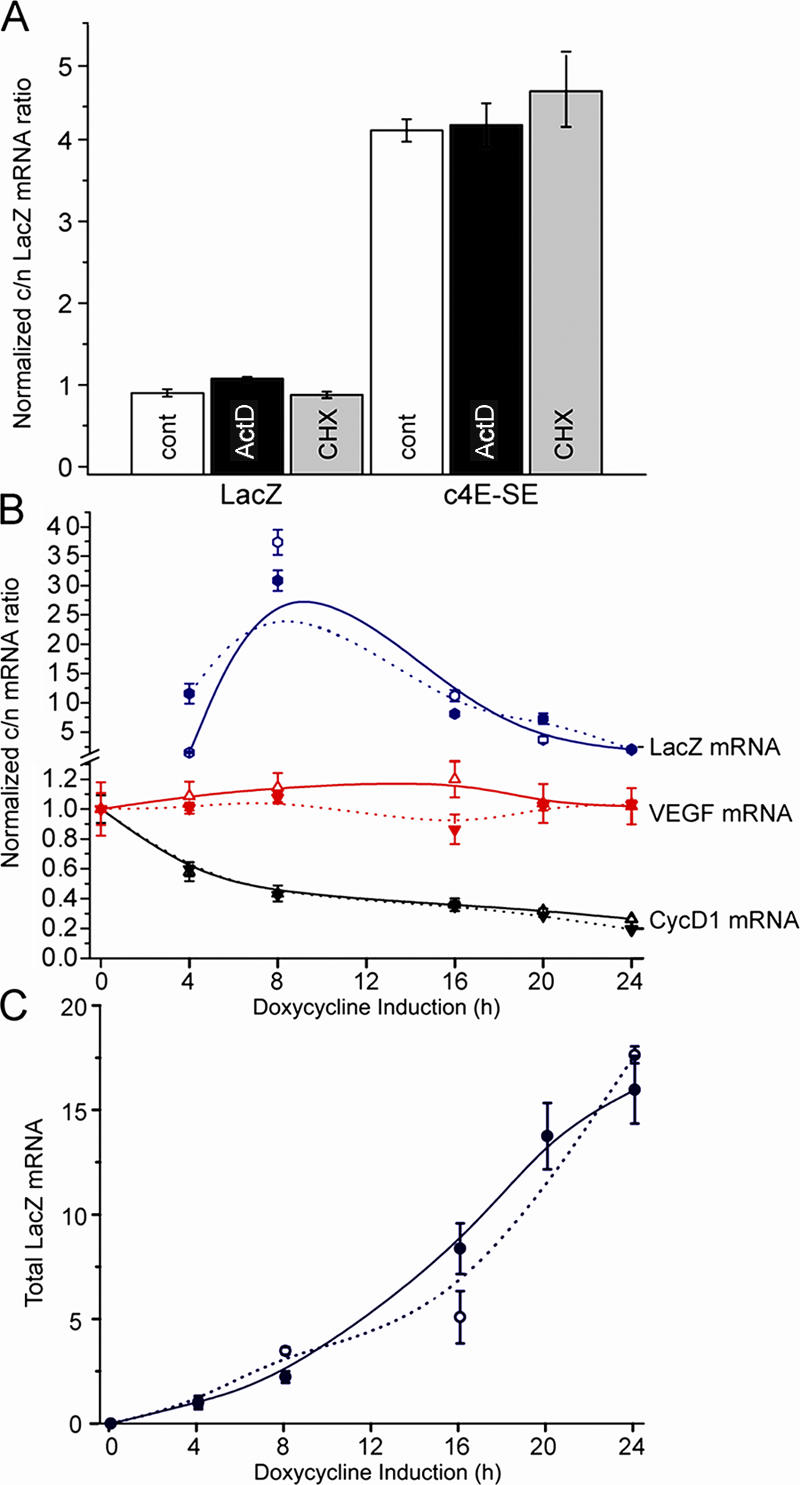
Export of 4E-SE–containing mRNAs is independent of ongoing RNA and protein synthesis, and the pathway is saturated by excess 4E-SE. (A) Quantitative real-time PCR analysis of mRNA export of lacZ–c4E-SE and lacZ in eIF4E-overexpressing cells. Cytoplasmic/nuclear (c/n) ratios represent relative fold ± SD (error bars) normalized to the lacZ untreated control, which was set to 1. Calculations were performed as described in Table II. Treatments were 10 μg/ml actinomycin D for 1 h and 100 μg/ml cycloheximide (CHX) for 1 h. (B and C) LacZ mRNA export was monitored as a function of both time and expression of lacZ transcripts ± 4E-SE induced with doxycycline. Expression as a function of time is shown. In parallel, the extent of export was monitored as the ratio of cytoplasmic/nuclear mRNA for each case. Solid lines represent trends in cells expressing lacZ–c4E-SE; dotted lines represent cells expressing lacZ–p4E-SE. Endogenous mRNAs from the same samples were also examined. Cyclin D1 mRNA export was reduced in cells expressing either lacZ–c4E-SE or lacZ–p4E-SE. Importantly, VEGF, which does not contain a 4E-SE, did not have its export affected in either case. Clearly, as the amount of 4E-SE–containing mRNAs increases in the cell (C), the ability to export these is reduced presumably because 4E-SE–dependent export becomes saturated (B). Cytoplasmic/nuclear values represent relative fold ± SD normalized to lacZ only for each time point as described in Table II. For total RNAs, values represent relative fold ± SD normalized to the first time point of induction for each transcript (4 h), which was set to 1. Average values of lacZ mRNA obtained for each time point were normalized by GAPDH mRNA values obtained for the same sample.