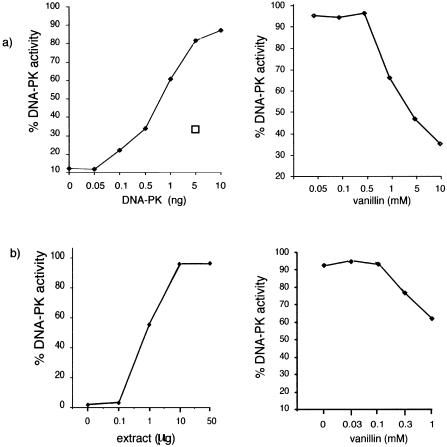
Figure 3.
DNA-PK activity. (a) Purified DNA-PK activity. Left panel, dose response of increasing concentrations of purified DNA-PK. Open box represents 0.25 µM wortmannin incubated with 5 ng DNA-PK. Right panel, activity of 1.5 ng DNA-PK pre-incubated for 5 min at 4°C with vanillin at varying concentrations. (b) DNA-PK activity using GM00558 extract. Left panel, dose response of increasing concentrations of extract. Right panel, activity of 1 µg extract pre-incubated with vanillin at increasing concentrations.

