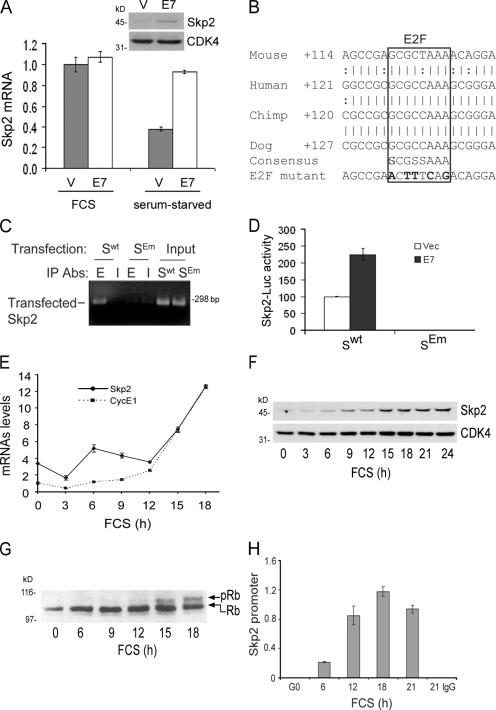
Figure 1.
A conserved E2F site in the Skp2 promoter. (A) Vector- (V) or E7- (E7) transfected MEFs were incubated in 10% FCS or serum starved. Skp2 mRNA levels were determined by QPCR and plotted relative to the levels observed in the vector-transfected cells incubated with 10% FCS. A duplicate experiment was Western blotted for Skp2 and Cdk4 (loading control). (B) The conserved E2F site on the mouse, human, chimp, and dog Skp2 promoters. The numbers shown are relative to the known or putative transcription start sites. (C) MEFs transfected with the wild-type Skp2 promoter– (Swt) or E2F-mutated Skp2 promoter– (SEm) luciferase constructs were analyzed by ChIP using anti-E2F1 (E) or preimmune IgG (I). (D) Skp2 promoter activity in serum-stimulated MEFs expressing Swt or SEm promoter–luciferase constructs and either empty vector or E7. After 24 h in 10% FCS, Skp2 promoter–luciferase activity was plotted relative to the activity of the wild-type Skp2 promoter transfected with empty vector. (E–H) Serum-starved MEFs were stimulated with 10% FCS. (E) The levels of Skp2 and cyclin E1 mRNAs were determined by QPCR and plotted relative to the level of cyclin E mRNA in the starved cells. (F) Total cell lysates were Western blotted for Skp2 and Cdk4 (loading control). (G) Total cell lysates were Western blotted for Rb; the hyper- and hypophosphorylated forms are shown by the top and bottom arrows, respectively. (H) ChiP was performed using anti-E2F1 or control IgG, and the results were quantified by QPCR. The level of immunoprecipitated Skp2 promoter is plotted relative to the input (×10−3). Error bars show mean ± SD.

